Benchmark Network-Attached Storage – It’s Harder Than You Think
May 22nd, 2025 | 13 min read
Table Of Contents
- Let Your Network Lie to You
- Protocol Overhead - Not Just Latency but Complexity
- Workload Fidelity: Your Benchmark Isn’t Realistic
- Caching: The Silent Benchmark Killer
- Data Locality and Infrastructure Topology
- Multi-Tenant, Quality of Service, and Rate Limits
- Benchmark Tools Lie—Because They Don’t Know Better
- How to Digest All of That?
TLDR: Many factors influence benchmarks for network-attached storage. Latency and throughput limitations, as well as protocol overhead, network congestion, and caching effects, may create much better or worse performance results than found in a real-world workload.
Benchmarking a storage solution, especially for network-attached storage, is supposed to provide us with a baseline for performance evaluation. You run the performance test, slap them into a dashboard, build a presentation, and that’s the basis for every further product evaluation.
What works great for local storage, where the SATA / SAS / PCI Express bus is your only foe, is more complicated when it comes to network-attached storage solutions (like NAS or SAN systems, NFS, Ceph, simplyblock, and similar alternatives). Benchmarking network storage quickly turns into an exercise of chasing ghosts, with multiple runs providing inconsistent results.
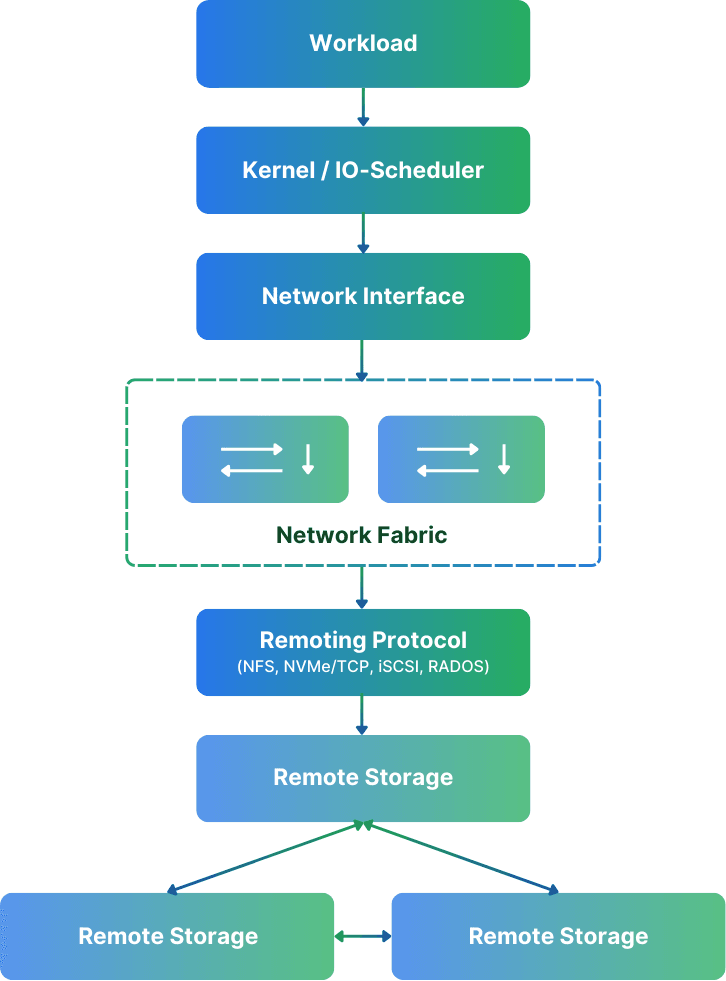
You’d think it’s pretty straightforward: you pick a tool (preferably fio), configure the workload, and hammer away on the storage target. But the catch is, network storage isn’t just a disk and a wire. It’s a full stack of components, from the server hardware (including the backing disks), the networking fabric (including switches, the wires, NICs), network protocols, and more.
All in all, benchmarking network storage is damn hard.
Let Your Network Lie to You
Modern networks are built to be robust and fault-tolerant. They are designed to provide reasonably consistent network performance. However, that wasn’t always the case, especially for Ethernet networks.
Fibre Channel and Infiniband were specialized storage networks designed to mitigate latency issues introduced in standard Ethernet networks. With higher bandwidth, these storage networks often provided better throughput, too. In recent years, however, Ethernet has just surpassed them. You can easily build a network with multiple 100G network cards, creating Tbit/s of throughput and enabling hundreds of millions of IOPS on a commodity Ethernet setup. Not even to talk about RDMA over Ethernet. If you ask me, a new storage network infrastructure should NEVER use any specialized Infiniband or Fibre Channel gear. Don’t waste your money!
Anyway, make sure you have a dedicated network for your storage traffic. Depending on the switches, a separate VLAN may be enough. Separate networks ensure as little congestion side effects (introduced by protocols such as TCP) as possible. In cloud environments, you also want to ensure that you use virtual machines (for client and servers) that offer dedicated network bandwidth. Up to means exactly how it sounds. You know how “up to” works for your internet connectivity, don’t you? 😀
For AWS, the easiest way to compare and find instances with dedicated network bandwidth is Vantage. I use it all the time. Just look for instances with a fixed number of bandwidth and no “up to.”
Also, ensure that your switches have enough switching bandwidth. Especially if you use core switches with multiple storage servers attached to them. Many clustered storage solutions, like simplyblock, have chatter and data traffic between storage nodes, not just your storage server and the client. Hence, you need to multiply the data traffic. A switch with insufficient or capped bandwidth may introduce unexpected performance bottlenecks.
Protocol Overhead – Not Just Latency but Complexity
Let’s say you’re testing NFS. On the surface, it’s just a shared filesystem, right? But under the hood, there’s a lot going on: stateless request/response semantics, per-operation metadata queries, and client-side caching behavior that can wildly distort results if not disabled.
Then look at Ceph. It’s no longer “just” a filesystem. You’re hitting one or more gateways (RADOS, NVMe/TCP) to talk to OSDs, which in turn map objects to placement groups. Possibly spread across replicated or erasure-coded pools. Every write will trigger multiple background operations, replication, recovery state, and rebalancing behavior.
Also, while simplyblock is easy to operate for the user, the internals aren’t as easy. Being fully built upon NVMe over Fabrics for internal and external cluster communication reduces the complexity and translation layers, though. Still, there is data and parity distribution for our distributed data placement, erasure coding, and the whole metadata subsystem handling. We aim to provide the most sensible defaults for NVMe/TCP or NVMe/RoCE, but there are plenty of options to bring into the system to achieve the theoretical maximum performance.
Each system has a different I/O path and different implications for performance under load. Understanding these differences and adjusting them accordingly is important when measuring a system’s performance.
Workload Fidelity: Your Benchmark Isn’t Realistic
Let’s be honest: most benchmarking setups are lazy. People grab fio, set a 4K random write workload with a queue depth of 32, and call it a day. And don’t believe most company-provided benchmarks are different.
The reason is simple. It’s extremely hard to create meaningful benchmarks with a mix of reads and writes that behave like the real world. Some databases have benchmarks that simulate a typical database workload (like TPC-C), but it’s still a simulation. It’s synthetic.
Real workloads aren’t uniform. Your databases are doing a mix of reads and writes, probably with varying block sizes and some random and some sequential access. While your backup jobs stream big chunks, they also walk metadata trees. And your VMs are booting off shared images with bursty IO patterns. Your AI workloads are snapshotting terabytes of checkpoints intermittently while hammering scratch space.
A synthetic benchmark doesn’t mirror your application’s behavior. I don’t want to say that synthetic benchmarks are worthless. They give a general idea of performance, but also a false sense of confidence. And when things go sideways in production, you won’t even know why, because the test said everything was fine.
That’s why understanding your access patterns, like read/write ratio, block size distribution, concurrency level, and file vs. block vs. object semantics, is crucial when designing a benchmark. If your storage system uses tiering, the impact of read amplification, write coalescing, and background data movement can swing performance by orders of magnitude, depending on how the test triggers them. And if your system uses replication or erasure coding, you’ll also see write amplification.
If you have the chance, use real-world data for testing performance. Create a copy of your actual database and have some duplicated live traffic running against it. If you run VMs, clone them and have them do their job. If you run AI training, run the same training as in production. Make sure your test workload is as real as it can be.
Caching: The Silent Benchmark Killer
Now that we have the biggest items out of the way (or so you think), there is caching. And oh boy, do we have a lot of caching layers in modern systems.
Your Linux client has the page cache, which will happily absorb read requests and make your storage look like it’s delivering 10 GB/s with 0µs latency. If your benchmark tool supports direct writes (O_DIRECT), enable it. If not, enjoy a cat and mouse game of how fast you can drop the caches.
Just the other day, I ran a PostgreSQL benchmark for simplyblock. Postgres, unfortunately, doesn’t support direct writes (yet). Hence, the option I went with was echo 3 > /proc/sys/vm/drop_caches. This forces Linux to drop all caches, but it immediately starts to refill them. Therefore, I created a script to loop as soon as the drop caches returned. The difference in performance was more than visible: 290,000 TPS vs 160,000 TPS (transactions per second).
Then again, many remote storage systems also have their own caches. These range from write-back buffers to local SSD caches, metadata caches, all the way to global distributed caches. It all depends on the system. And unless you know exactly when and how those caches are warming, flushing, or filling up, your tests are basically measuring some unknowable hybrid of actual storage performance and whatever cache state happened to exist at test time. If you have the chance, disable caches!
Either way, ensure your tests run for more than a few minutes. Do preruns and see where performance stabilizes. Remove the initial period where performance is flaky. But also ensure you’re running a sustainable workload to pressure the system enough.
Data Locality and Infrastructure Topology
Okay, so far, everything looks good. Your workload is meaningful, your caches are disabled, and the network is separated and tuned. Still, the numbers are all over the place and never stabilize.
Time to get into data locality and infrastructure topology. In a distributed system, data placement matters. In a system like simplyblock, we have two ways to distribute data. The first, and recommended way, is that the first data chunk for storing and erasure coding is placed on the host that “owns” the logical volume, and further data chunks are distributed in the cluster. However, you can put all data chunks on different cluster nodes, increasing the number of network roundtrips. You’ll get fan-out and fan-in behavior that skews your latency and throughput.

If you’re on Ceph and your client is talking to OSDs across different racks—or worse, different failure domains. You’re not just fighting latency. You’re increasing cross-rack traffic and adding contention to your backbone.
And don’t forget client-to-target mapping. Systems like NFS might allow some affinity to be configured via mount options. However, that goes out the window if you’re behind a load balancer or gateway that spreads I/O across nodes without following your locality requests.
Last but not least, in cloud or virtualized environments, this becomes even more chaotic. You could be running on a VM that’s getting live-migrated during your benchmark, or sharing a noisy NIC with someone else’s Kubernetes cluster doing god-knows-what.
Make sure you understand how data is placed in your remotely attached storage. Ensure that different systems use similar configurations (at least as similar as possible) to create comparable results. A benchmark with a perfectly placed data set on simplyblock isn’t equivalent to a super spread-out Ceph benchmark (not that Ceph has any chance even if it’s the other way around—yes I’m biased 😂).
Multi-Tenant, Quality of Service, and Rate Limits
This is a really tricky one. You might think your storage system is all yours. But if it’s a shared cluster—whether you’re using it internally or paying for it in the cloud—then your benchmark results are subject to all the traffic you don’t see.
Quality of Service (QoS) and rate limits can throttle you even if there’s capacity left, just because you’ve hit your IOPS ceiling, provisioned throughput, or your latency SLA.
This is especially hard in public cloud environments. While performance is commonly maxing out what you provision, the “what you provision” is the crucial part. It means you must understand your workload requirements to make good decisions. Also, if the storage performance is limited, what would the benchmark tell you about the available performance? Nothing.
Even worse, if your system has burst credits, token buckets, or any kind of rate limiter, you’ll see good performance… until you hit the wall. Then it’s a free-fall into degraded performance that’s hard to correlate with anything in the benchmark output unless you’re watching in real time with observability tools. As mentioned before, this can often be mitigated by having the benchmark run long enough. However, if you get rate-limited, your benchmark results aren’t helpful anymore—except you want to measure the bursting.
Benchmark Tools Lie—Because They Don’t Know Better
Even the tools you use to measure performance can mislead you. While fio is excellent, it only knows what the kernel tells it. It doesn’t know about things like TCP retransmissions, protocol-specific congestion, storage-level background jobs, compression, encryption, and whatnot.
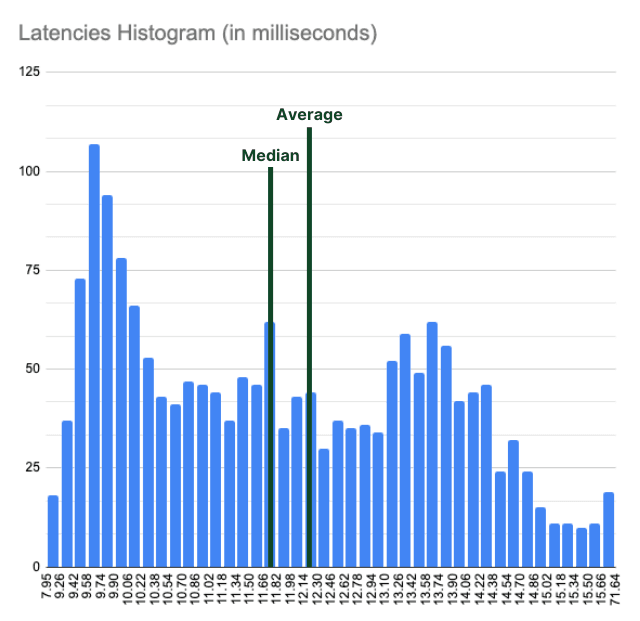
When running performance benchmarks of any kind (but specifically storage benchmarks), ensure to capture the raw data. You need to plot latency histograms and calculate the 99.9th percentile. You want to see bandwidth dips and generally any kind of outliers. Otherwise, you’re missing the real story. Outliers matter. A single blip to 200ms latency can tank a database transaction, even if your average is 2ms.
How to Digest All of That?
There’s no silver bullet here. But if you want benchmark results that reflect reality, not fantasy, you need discipline and awareness. And, if possible, real-world data and traffic.
Start by defining what you really want to test. Is it peak throughput? Tail latency under pressure? Write amplification? Then build a test that simulates that, not just something that maxes out your NIC for a cool demo. If the cool demo is what you want, go for it, though.
Disable all the caches you can. Tune your network stack. Ensure dedicated network bandwidth. Optimize the hell out of your benchmark clients, your storage systems, and your switches. Run long enough to hit the slow paths, not just the hot paths, and wait for the benchmark numbers to stabilize.
Capture raw data and interval timing for histograms, percentiles, averages, and median. If you can, capture additional information on switches (such as bandwidth). Correlate and ensure that matching values have causality. If not, find the error and retry. That’s how I found an unexpected behavior in simplyblock at a blocksize of 64K. While not tragic, it really didn’t fit the expectation with numbers in between 16K and 128K. It made us look deeper into it, and yeah, we found something to optimize.
Ultimately, you should measure as if your production depends on it, because eventually it does.
If you’re benchmarking simplyblock’s NVMe/TCP storage backend, you’re already in a better place than most. You’ve got clean protocol semantics, proper QoS enforcement, and a sane, NVMe-first architecture.
Storage performance isn’t just about how fast you can write—it’s about how consistently you can write under load, during failures, and while the rest of the system is doing something else entirely.
Simplyblock provides high-performance, stable, and ultra-low latencies. Especially compared to other network-attached storage solutions. And that’s what makes it fun. Find all the benefits of simplyblock!