IOPS vs Throughput vs Latency – Storage Performance Metrics
Apr 24th, 2024 | 15 min read
Table Of Contents
- What is IOPS?
- How to Calculate IOPS?
- What is Throughput?
- How to Calculate Throughput?
- IOPS vs Throughput
- What is Latency?
- How are IOPS, Throughput, and Latency Related?
- Reads and Writes
- Why do I have more Reads than Writes?
- Why do I have more Writes than Reads?
- Why do I have Writes Only?
- Reads and Writes Distribution
- Why Block Size Matters
- Summary
- Questions and Answers
IOPS, throughput, and latency are interrelated metrics that provide insight into the read, write, and access performance of storage entities and network interconnects.
IOPS means input/output operations per second. It tells you how many read or write requests storage completes each second. IOPS matters most for small, random I/O like databases and Kubernetes workloads. Throughput matters more for large, sequential transfers like backups and media. Latency often caps IOPS because every operation needs time to finish.
Measuring the performance of a storage solution isn’t hard, but understanding the measured values is. IOPS, throughput, and latency are related to each other, but how? In this blog post I try to explain how they are related and what you should know to really get the most out of your performance test.
IOPS, throughput, and latency are all very important metrics. HDDs (spinning or rotating disks), SSDs (I mean SATA or SAS connected ones), and NVMe devices (connected through some PCIe one way or the other), have very different performance profiles.
Simplyblock’s storage engine uses NVMe disks and the NVMe protocol to provide its virtual (or logical) storage volumes to the outside world. Enough of simplyblock, though, let’s get into the performance metrics!
What is IOPS?
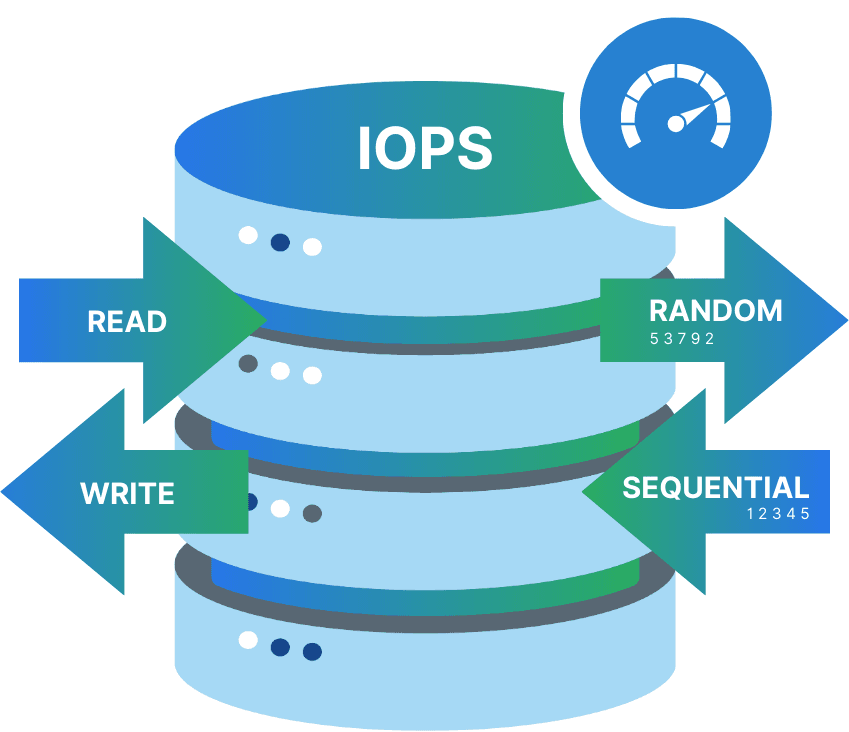
IOPS (pronounced as eye-ops) means input/output operations per second. An IOPS basically says how many actual read or write operations a storage device can perform (and sustain) in a single second.
Reads are operations that access information stored on the storage device, while writes perform operations adding new or updating existing information on the disk.
As a good rule of thumb, higher IOPS means better performance. However, it is important to understand how IOPS relates to throughput and block size. A measured or calculated amount of IOPS for one specific block size doesn’t necessarily translate to the same amount of IOPS with another block size. We’ll come back to block size later.
How to Calculate IOPS?
Calculating IOPS is a fairly simple formula. We take the throughputs (read and write combined) and divide it by the number of seconds we measured.
IOPS = (ReadThroughputs + WriteThroughputs) / TimeInSeconds
With that knowledge we can actually simplify the calculation down to a single measurement of read and write throughput.
IOPS = (ReadThroughput + WriteThroughput) / BlockSize
How to calculate IOPS (example with 4K blocks)?
IOPS is “operations per second,” not “MB/s.” Throughput depends on IOPS and block size. Use this rule of thumb:
Throughput (MB/s) = IOPS × Block size (KB) ÷ 1024.
Example with 4K blocks.
10,000 IOPS × 4 KB = 40,000 KB/s.
40,000 ÷ 1024 ≈ 39 MB/s.
Key takeaway: Block size links IOPS and throughput.
If you keep throughput constant and increase block size, IOPS drops.
If you keep IOPS constant and increase block size, throughput rises.
Latency often increases with larger blocks because each I/O transfers more data, but it depends on the storage and queue depth.
With spinning disks it is a bit more complicated since we have additional seek times. Since spinning disks aren’t used for high-performance storage anymore, I’ll leave it out.
Anyhow, while this sounds easy enough, sometimes, write operations require additional read operations to succeed. That can happen in a RAID setup (or similar technologies like erasure coding), where multiple bits of information are “mathematically” connected into recovery information (often called parity data). Meaning, we take two (or more) input information, connect them through some mathematical formula, and write the result to different disks.
As a result, we can lose one of the input information but use the calculation result and the other input information to reverse the mathematical operation and extract the lost information. Anyway, the result is that we have 1 additional read and 1 additional write for every write operation:
- Write: New information to write
- Read: Second information input for mathematical calculation
- Write: Recovery calculation result
For reading data from such a setup, as long as the information to be read isn’t lost, it’s a single-read operation. In the case of recovering the information due to disk failure (or any other issue), there will be two read operations (parity and the second information input), as well as the reversed mathematical operation.
When calculating how many IOPS storage can sustain, we need to make sure we take those cases into account. And finally, some storage solutions may have a slightly asynchronous ability when it comes to writing and reading, meaning they aren’t equally fast. That said, to find the max IOPS value, we may have to test with a 60:40 read-write ratio or any other one. This is a plain trial and error situation. It’s always best to test with your specific use case and read-write ratio.
What is Throughput?
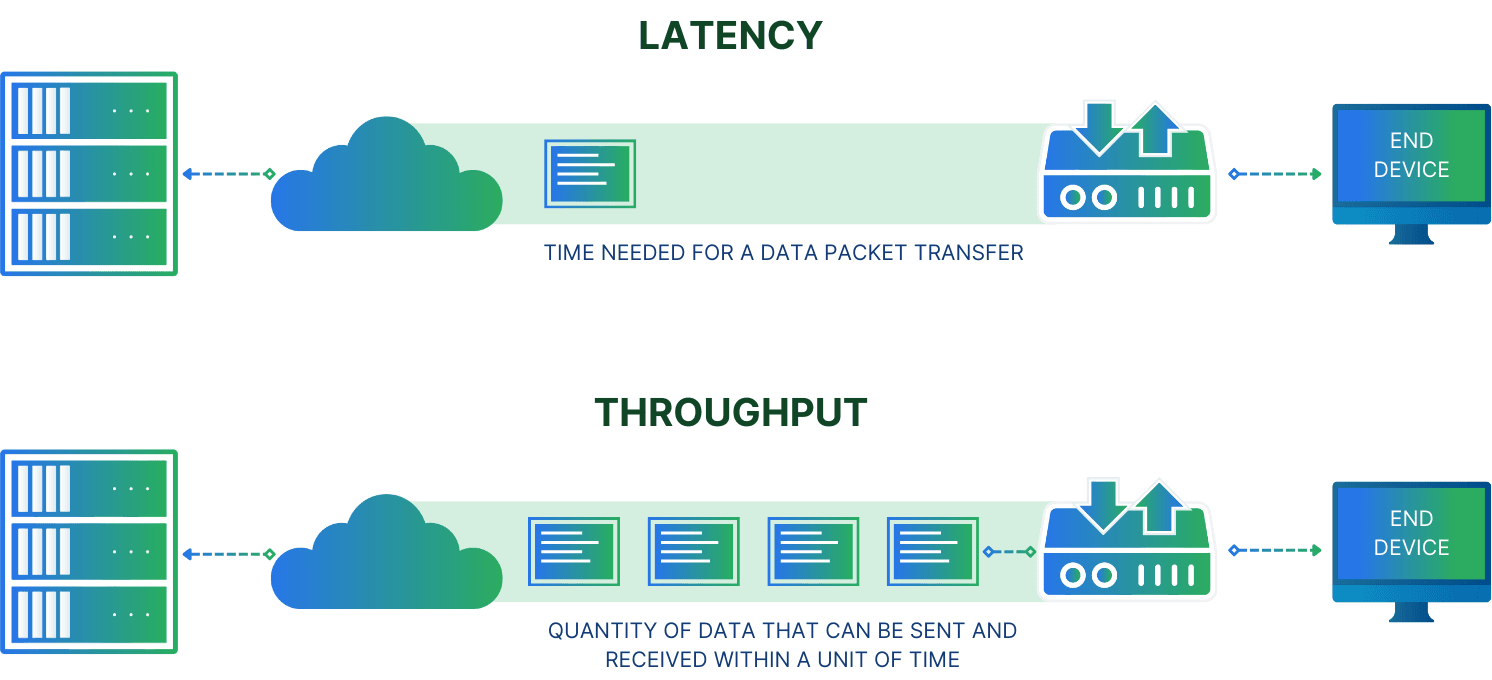
Throughput is the measurement of how much data can be transferred (read or written) in a given amount of time, for storage solutions it’s typically a measure in bytes per second. Just be careful since there are metrics using bits per second, too. Especially when your storage is connected via a network link (like Ethernet or FiberChannel).
A higher throughput normally means better performance, as in faster data transfers. In comparison to IOPS, throughput tells us a specific amount of data that can be read or written in a given amount of time. This metric can be used directly to understand if a storage solution is “fast enough.” It will not tell us if you can sustain a certain pattern of read or write operations though.
How to Calculate Throughput?
To calculate the throughput without measuring it, we take the amount of IOPS (read and write) and multiply it by the configured block size.
Throughput = (Read IOPS + Write IOPS) x BlockSize
We differentiate between read and write IOPS because the maximum amount of IOPS for either direction may not necessarily equal the other direction. See the How to Calculate IOPS section for more information.
IOPS vs Throughput
Since IOPS and throughput are related to each other. That means, to give a full picture of storage performance both values are required.
Throughput gives us a feeling of how much actual data we can read or write in a given amount of time. If we know that we have to write a 1GB file in less than 10 seconds, we know what write throughput is required.
On the other hand, if we know that our database makes many small read operations, we want to know the potential read IOPS limit of our storage.
Anyhow, there is more to performance than those two metrics, latency.
What is Latency?
Latency, in storage systems, describes the amount of time a storage entity needs to process a single data request. With spinning disks that included seek time (the time to find a specific location and position the read-write heads and for the platter to be at the correct position), but it also includes computation time inside the disk controller.
The latter still holds true for flash storage devices. Due to features such as wear leveling, the controller has to calculate where a piece of information is stored at the current point in time.
That said, latency directly affects how many IOPS can be performed, hence the throughput. Thanks to flash technology, the latency these days is fairly consistent (per device) and doesn’t depend on the physical location anymore. With spinning disks, the latency was different depending on the current and new position of the heads and if the information was stored on the inside or outside of the platter. Luckily, we can ignore this information today. Measuring the latency once per disk should be enough.
How are IOPS, Throughput, and Latency Related?
IOPS, throughput, and latency are directly related to each other but provide different information.
While IOPS tells us how many actual operations we can perform per second, throughput tells us how much data can be transferred at the same time. Latency, however, tells us how long we have to wait for this operation to be performed (or finished, depending on what type of latency you’re looking for).
There is no one best metric, though. When you want to understand the performance characteristics of a storage entity, all 3 metrics are equally important. Though, for a specific question, one may have more weight than the other.
Reads and Writes
So far, we have always talked about reading and writing. We also mentioned that their ratio may impact the overall performance. In addition, we briefly talked about RAID and erasure coding (and now I just throw in the mix mirroring or replication).
Diverging read and write speeds mostly come from hardware implications, such as flash cells needing to be erased before being written. That, inherently, makes writes slower.
For other situations, such as RAID and similar, additional reads or writes have to be executed so that the effective write IOPS value may be different from the physically possible write IOPS one.
Generally, it’s a valid approach to try to find the absolute maximum read and write values (in terms of throughput and IOPS) by trying out different ratios of writing and reading in the same test. I’d recommend starting with a 50:50 ratio and then going 60:40 or 40:60, seeing which one has the higher result, and then making smaller steps (1 or 5 increments or decrements) until you seem to get the highest numbers.
This doesn’t necessarily reflect your real-world pattern, though, because depending on the workload you run, you may have a different ratio requirement.
Why do I have more Reads than Writes?
Workloads like static asset web servers (found on CDN providers), generally, have a much read than write rate. I mean their whole purpose is to cache data from other systems and present them as fast and as many times as possible. In this case, the storage should provide the fastest read throughput, as well as the highest read IOPS.
While those systems need to store and update existing data in the cache, the extreme imbalance of read overwrite makes write performance (almost) negligible.
Another example of such a system may be an analytics database, which is filled with updated data irregularly but is used for analytical purposes most of the time. That means that while a lot of data is probably written in a short amount of time (ingress burst), the data is mostly read for running queries and analytics requests.
Why do I have more Writes than Reads?
Data lakes, or IoT databases, often see much higher writes than reads. In both situations we want to optimize the storage for faster writes.
Data lakes commonly collect data for later analytics. The collected data is often pre-evaluated and used as a training set for algorithms such as fraud detection.
With IoT databases, the amount of data being delivered from IoT devices is often much higher than what is necessary to present to the user. For that reason, many databases optimized for IoT data (or time series data in general) have features to pre-aggregate data for dashboards, hence increasing the write rates even higher. Anyhow, many such databases are optimized to hold the active data set (the data commonly presented to users) in RAM to prevent it from being read from disk, decreasing the typical read rates further.
Why do I have Writes Only?
Finally, there are systems that observe pretty much only writes. These include mirrors or something like hot standby systems. In this case, changes on a primary system are replicated to the mirror and written down. While the system is “waiting” for itself to become the primary, there are basically no read operations happening.
Reads and Writes Distribution
Depending on your workload, your read-write ratio will change. Before trying to find out if a storage solution fits your needs, you should figure out what your workload’s real-world distribution looks like. Only afterward is there a way to really make an educated guess.
Generally speaking, the read-write distribution will change the outcome of your tests. While a storage solution may have a massive amount of IOPS, the question is more around whether it can sustain the IOPS. At what block size can I expect those amounts of IOPS? And how those IOPS values will change when I change the block sizes.
Different workloads have different requirements. Just keep that in mind.
Why Block Size Matters
Finally, block size. We talked about it before over and over again. The block size defines how much data (in bytes) is read or written per operation. That said, 1000 operations (IOPS) with each 8KB means that we manage to read 8000KB (or 8MB) per second. We immediately see our throughput.
Does that mean that with 64KB block size, I get 8 times the speed? It depends. We all hate this answer, but it does.
It mostly depends on how the storage solution is built and how it is connected. Say, you have a network interconnect to the storage solution of 1Gbit/s, I can get roughly 125MB/s through the wire. 64KB x 1000 IOPS results in 64MB/s, so it should fit. If I increase the block size to 128KB, the network bandwidth is now the limiting factor.
Anyhow, the network isn’t your only limiting factor. Transferring larger block sizes needs more time, meaning your potential maximum IOPS will drop. Though, what I didn’t tell you before, when running your benchmark and trying to find the perfect read-write ratio, you can also play with the block size values. There is a good chance that the default block size may not be the perfect one.
Summary
That was a lot of information. Your two main metrics are IOPS and throughput. Latency should be measured but can be considered stable for most flash based systems today. Block size is something to experiment with. It will directly impact both IOPS and throughput, but only if you reach another limiting factor (mostly likely some bandwidth limitation).
Up to that point, you can try and increase the block size for best performance. Remember, you may also have to make changes to your workload configuration or implementation to make use of the increased block size.
The following table is supposed to help a bit in terms of judgment of both IOPS and throughput.
| IOPS | Throughput | |
|---|---|---|
| Measurement | Input/Output operations per second | (Mega-)Bytes per second |
| Meaning | The amount of input/output (read or write) operations per second. | The amount of data (in bytes) that can be transferred through the storage connection per second. |
| Difficulty | Measurement requires specific software, and measurements depend directly on the selected block size. For measurements, I’d recommend the command line tool fio. | Easy to measure. Most operating systems have built-in tools for that or provide tools in the repositories (such as iostat). A specialized tool such as fio can help with benchmarking. |
| Where it helps | If you have a lot of random I/O, throughput will not be a good measurement due to the influences of latency and queuing of storage requests. | Good measurement of random and small operations. |
| Where is doesn’t help | Doesn’t say much about the amount of data that can be transferred. Also very much dependent on the chosen block size. | If you have a lot of random I/O, throughput will not be a good measurement due to influences of latency and queuing of storage requests. |
That said, both metrics, IOPS and throughput, are useful for assessing the performance of a storage system. They shouldn’t be used in isolation, though.
Simplyblock provides a disaggregated storage solution for latency-sensitive and high-IO workloads in the cloud. To achieve that, simplyblock creates a unified storage pool of NVMe disks connected to the simplyblock cluster nodes (virtual machines) and offers logical volumes through NVMe over TCP. Those logical volumes will be distributed across all connected cluster nodes and disks and secured using erasure coding, bringing the highest performance without sacrificing fault tolerance. Learn now more about simplyblock, or get started right away.
Questions and Answers
IOPS (Input/Output Operations Per Second) measures how many read or write operations a storage system can perform per second. It’s a key metric for performance in databases, VMs, and Kubernetes workloads, especially for random I/O patterns.
“Good” depends on block size, latency, and workload. Databases usually need high 4K random read IOPS. Streaming jobs care more about throughput.
4K is a common baseline for random I/O. 8K and 16K are common for databases too. Match your real application I/O size.
IOPS measures the number of operations per second, while throughput measures the amount of data transferred per second (typically in MB/s or GB/s). High IOPS is ideal for small, frequent operations, whereas high throughput is crucial for large, sequential transfers like backups or video processing.
Latency refers to the time it takes to complete a single I/O operation. Lower latency means faster response times for applications. Workloads like real-time analytics or AI benefit from low-latency NVMe storage over traditional disk-based systems.
Use high-performance block storage with NVMe over TCP, minimize disk contention, and provision volumes using CSI with optimized settings. Simplyblock offers Kubernetes-native storage designed to boost IOPS and lower latency automatically.
Tools like FIO, ioping, and sysbench help benchmark storage performance. For Kubernetes environments, these can be run inside pods or integrated into CI pipelines to evaluate persistent volume behavior across different workloads and block sizes.
Each I/O must complete before it counts. Lower latency means more completed operations per second. Queueing can hide latency until the system saturates.