Benchmarking Simplyblock Storage on ClickBench with PostgreSQL and DuckDB
Jul 24th, 2025 | 9 min read

Table Of Contents
- Test Environment
- 🐘 PostgreSQL: Raw and Indexed Queries
- ClickBench Results: PostgreSQL without Indexes
- ClickBench Results: PostgreSQL with Indexes
- Simplyblock and PostgreSQL
- 🦆 DuckDB: Single File vs Partitioned Parquet
- ClickBench Results: DuckDB with Single Parquet File
- ClickBench Results: DuckDB with Partitioned Parquet Files
- Simplyblock and DuckDB
- Simplyblock: Performance of Local Disks with the Flexibility of Distributed Storage
As storage demands scale and workloads become increasingly performance-sensitive, the right infrastructure choices can drive massive gains in both throughput and efficiency. At simplyblock, we set out to validate the performance of our storage layer using the industry-standard ClickBench benchmark suite.
Thanks to the vast number of available databases supported databases, ClickBench is a perfect tool to run database benchmarks and adjust them to new environments quickly. We tested two popular databases—PostgreSQL and DuckDB—backed by simplyblock’s high-performance software-defined storage.
Test Environment
One of the major factors when running benchmarks is the environment used. Many original ClickBench results utilize AWS virtual machines or proprietary hardware. Simplyblock, however, used Google Compute Engine (GCP) to run the test. This was a cost-efficiency choice and doesn’t reflect any preference of GCP over AWS on simplyblock’s side.
Original Infrastructure: ClickBench
- PostgreSQL:
- AWS instance type: c6a.4xlarge
- 16 vCPUs (x86_64), 32 GB RAM
- Amazon EBS storage volume
- DuckDB:
- AWS instance type: c6a.metal
- 192 vCPUs (x86_64), 384 GB RAM
- Amazon EBS storage volume
Simplyblock-Backed Infrastructure
PostgreSQL runs:
- GCP Instance type: c3-standard-88
- 88 vCPUs (x86_64), 352 GB RAM
- 100 Gbit/s Tier 1 networking
- 6 simplyblock logical volumes, connected via NVMe over TCP, LVM-striped XFS volumes for WAL and table data, enabling maximum parallelism
⚠️ Note: Despite the larger instance size, vCPU and RAM usage were limited during the benchmark to match the original ClickBench spec (16 vCPUs, 32 GB RAM) to ensure a fair comparison. The larger instance was chosen solely to meet GCP’s higher network throughput requirements.
Simplyblock storage cluster:
- 3× c4a-standard-64-lssd instances, each with:
- 64 ARM cores (AARCH64, Google Axion)
- 256 GB RAM
- 14x Local SSDs (NVMe, 375 GB each)
- 75 Gbit/s Tier 1 networking
- Each host ran 2 simplyblock nodes, totaling 6 distributed storage nodes
🐘 PostgreSQL: Raw and Indexed Queries
Test Scenarios:
- PostgreSQL without indexes
- PostgreSQL with indexes
Each was tested against the given baseline on ClickBench (most likely AWS EBS) with a simplyblock-backed storage. CPU and RAM was limited. No other configuration changes were applied.
Key Observations:
| System | Load Time | Benchmark Runtime (warm) |
| PostgreSQL | 937 s | 11908 s |
| Simplyblock+PostgreSQL | 775 s | 668 s |
| PostgreSQL (Indexed) | 10357 s | 4098 s |
| Simplyblock+PostgreSQL (Indexed) | 5560 s | 1264 s |
✅ Simplyblock reduced the benchmark runtime by up to 18x, with significant improvements even when indexes were used.
✅ Simplyblock reduced the runtime of certain queries by over 5000x with an average of over 500x.
✅ Simplyblock reduced load time by up to 47%, thanks to parallel ingestion on NVMe-backed volumes.
ClickBench Results: PostgreSQL without Indexes
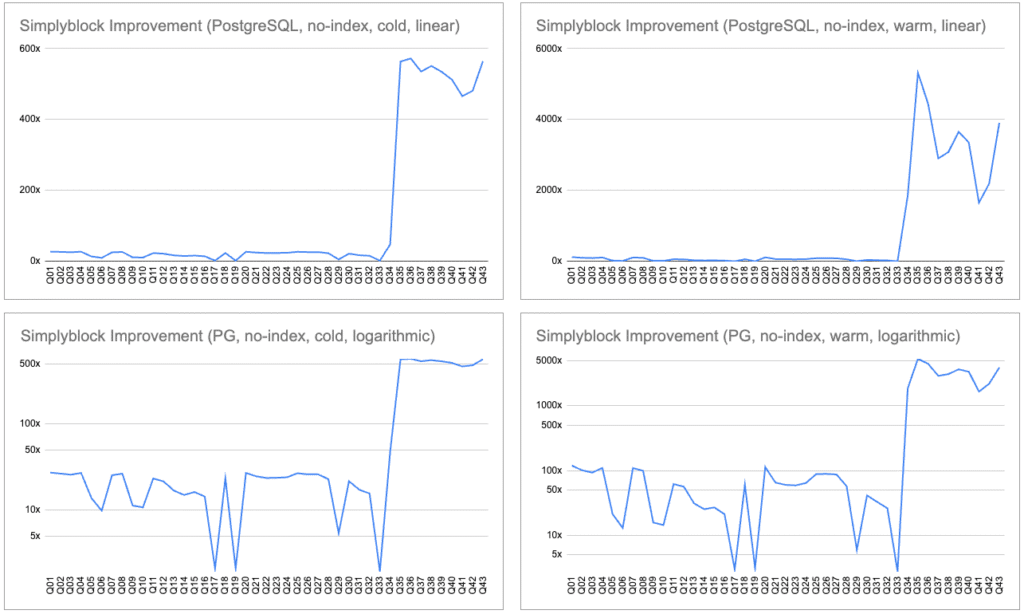
This benchmark compares runs for PostgreSQL without indexes on the baseline Amazon EBS vs. simplyblock storage.
Execution ratios range from 2x to over 5000x, with cold queries consistently being 10–270x faster and warm queries showing especially high improvements in complex queries.
When PostgreSQL is forced to scan tables (due to lack of indexes), storage performance becomes the dominant factor. That said, PostgreSQL’s performance is typically limited by disk I/O.
Simplyblock’s high-bandwidth, parallelized storage backend drastically reduces execution time for nearly every query. Our NVMe-over-TCP-based storage offers much higher throughput and parallelism compared to AWS EBS, translating to significant speedups, especially in I/O-heavy workloads.
| Query | PG (cold) | SB+PG (cold) | Rel. Speed | PG (warm) | SB+PG (warm) | Rel. Speed |
|---|---|---|---|---|---|---|
| Q01 | 269.992 | 9.881 | 27.32x | 258.534 | 2.165 | 119.44x |
| Q02 | 269.522 | 10.125 | 26.62x | 259.254 | 2.566 | 101.04x |
| Q03 | 269.672 | 10.441 | 25.83x | 258.531 | 2.780 | 92.99x |
| Q04 | 269.461 | 9.950 | 27.08x | 258.512 | 2.355 | 109.77x |
| Q05 | 284.235 | 20.557 | 13.83x | 272.647 | 12.802 | 21.30x |
| Q06 | 289.912 | 29.339 | 9.88x | 278.201 | 21.438 | 12.98x |
| Q07 | 269.372 | 10.583 | 25.45x | 258.468 | 2.365 | 109.31x |
| Q08 | 269.439 | 10.137 | 26.58x | 258.398 | 2.600 | 99.40x |
| Q09 | 296.872 | 26.183 | 11.34x | 285.173 | 18.111 | 15.75x |
| Q10 | 299.051 | 27.723 | 10.79x | 286.864 | 19.880 | 14.43x |
| Q11 | 270.779 | 11.602 | 23.34x | 258.948 | 4.182 | 61.92x |
| Q12 | 271.246 | 12.558 | 21.60x | 259.282 | 4.598 | 56.39x |
| Q13 | 274.954 | 16.276 | 16.89x | 263.681 | 8.436 | 31.26x |
| Q14 | 279.042 | 18.559 | 15.04x | 267.310 | 10.555 | 25.33x |
| Q15 | 276.684 | 17.012 | 16.26x | 265.207 | 9.825 | 26.99x |
| Q16 | 284.920 | 19.784 | 14.40x | 273.518 | 12.906 | 21.19x |
| Q17 | 475.078 | 226.061 | 2.10x | 458.150 | 154.078 | 2.97x |
| Q18 | 279.843 | 11.876 | 23.56x | 268.654 | 4.414 | 60.87x |
| Q19 | 312.733 | 148.571 | 2.10x | 301.210 | 96.187 | 3.13x |
| Q20 | 269.059 | 9.951 | 27.04x | 258.052 | 2.276 | 113.38x |
| Q21 | 269.002 | 10.867 | 24.75x | 258.047 | 3.956 | 65.23x |
| Q22 | 269.348 | 11.389 | 23.65x | 258.018 | 4.290 | 60.15x |
| Q23 | 269.183 | 11.310 | 23.80x | 258.001 | 4.367 | 59.08x |
| Q24 | 269.073 | 11.143 | 24.15x | 258.042 | 4.011 | 64.33x |
| Q25 | 269.053 | 10.016 | 26.86x | 257.948 | 2.927 | 88.14x |
| Q26 | 269.056 | 10.316 | 26.08x | 257.993 | 2.903 | 88.87x |
| Q27 | 269.003 | 10.310 | 26.09x | 257.894 | 2.961 | 87.10x |
| Q28 | 269.042 | 11.714 | 22.97x | 257.892 | 4.508 | 57.20x |
| Q29 | 279.737 | 51.639 | 5.42x | 268.922 | 45.048 | 5.97x |
| Q30 | 269.093 | 12.373 | 21.75x | 258.109 | 6.244 | 41.34x |
| Q31 | 274.112 | 15.863 | 17.28x | 262.274 | 8.001 | 32.78x |
| Q32 | 276.589 | 17.682 | 15.64x | 264.565 | 10.093 | 26.21x |
| Q33 | 483.774 | 248.939 | 1.94x | 477.739 | 172.907 | 2.76x |
| Q34 | 355.672 | 7.416 | 47.96x | 349.196 | 0.188 | 1855.95x |
| Q35 | 358.660 | 0.637 | 563.36x | 347.177 | 0.065 | 5318.80x |
| Q36 | 276.363 | 0.483 | 572.09x | 264.730 | 0.060 | 4443.27x |
| Q37 | 269.117 | 0.503 | 535.15x | 257.638 | 0.089 | 2901.18x |
| Q38 | 268.828 | 0.488 | 550.99x | 257.621 | 0.084 | 3083.21x |
| Q39 | 268.871 | 0.503 | 534.39x | 257.674 | 0.071 | 3652.88x |
| Q40 | 269.206 | 0.526 | 512.27x | 257.617 | 0.077 | 3351.02x |
| Q41 | 268.784 | 0.577 | 465.93x | 257.674 | 0.156 | 1654.48x |
| Q42 | 268.708 | 0.559 | 480.63x | 257.519 | 0.117 | 2193.35x |
| Q43 | 268.614 | 0.476 | 564.30x | 257.557 | 0.066 | 3907.14x |
ClickBench Results: PostgreSQL with Indexes
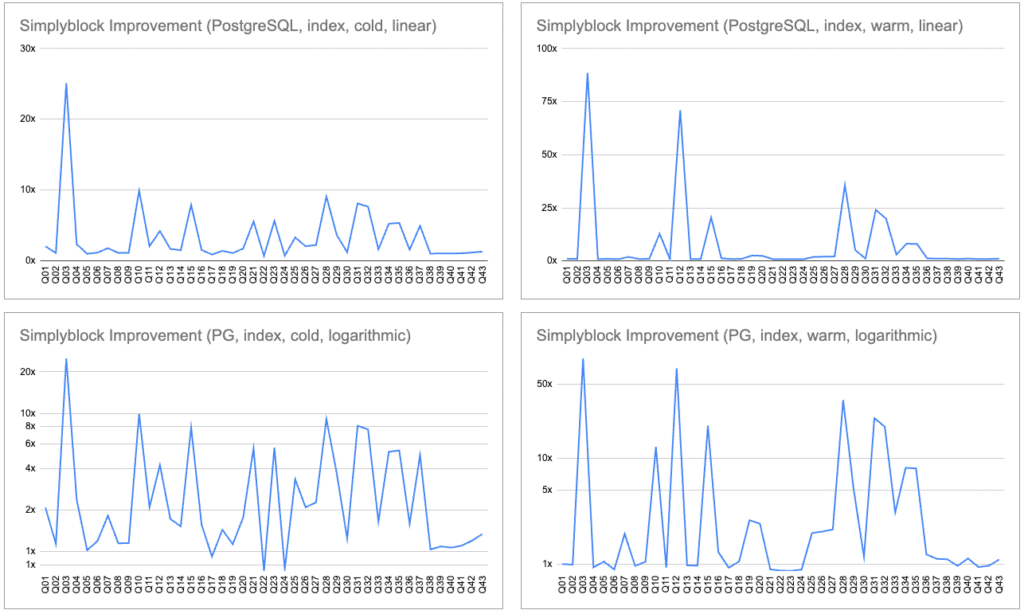
In this test, PostgreSQL used indexes, reducing the storage dependency but increasing the load time significantly. Yet, simplyblock still provided 2–25x speedups on many cold and warm queries. Some queries saw near parity or slight regressions, mostly due to PostgreSQL’s internal optimizations masking storage advantages.
Even when indexes limit I/O needs, simplyblock still enhances performance by ensuring fast data fetches and load operations. This proves its value even in optimized, production-like scenarios where queries use indexes extensively.
Interestingly, some queries are faster without indexes. This shows the benefit of using extremely fast storage underneath PostgreSQL, with the option to reduce DDL complexity and remove the computational overhead of the indexing.
| Query | PG Idx (cold) | SB+PG Idx (cold) | Rel. Speed | PG Idx (warm) | SB+PG Idx (warm) | Rel. Speed |
|---|---|---|---|---|---|---|
| Q01 | 5.065 | 2.448 | 2.07x | 0.767 | 0.765 | 1.00x |
| Q02 | 1.363 | 1.204 | 1.13x | 0.706 | 0.714 | 0.99x |
| Q03 | 248.885 | 9.919 | 25.09x | 237.619 | 2.684 | 88.52x |
| Q04 | 8.286 | 3.488 | 2.38x | 1.307 | 1.404 | 0.93x |
| Q05 | 8.100 | 7.949 | 1.02x | 7.279 | 6.880 | 1.06x |
| Q06 | 11.367 | 9.588 | 1.19x | 6.390 | 7.186 | 0.89x |
| Q07 | 0.037 | 0.020 | 1.81x | 0.000 | 0.000 | 1.94x |
| Q08 | 1.426 | 1.248 | 1.14x | 0.696 | 0.722 | 0.96x |
| Q09 | 11.828 | 10.309 | 1.15x | 8.181 | 7.786 | 1.05x |
| Q10 | 278.031 | 28.011 | 9.93x | 267.477 | 20.817 | 12.85x |
| Q11 | 9.377 | 4.489 | 2.09x | 2.062 | 2.225 | 0.93x |
| Q12 | 854.244 | 201.946 | 4.23x | 744.483 | 10.481 | 71.03x |
| Q13 | 5.091 | 2.966 | 1.72x | 2.279 | 2.346 | 0.97x |
| Q14 | 19.979 | 13.185 | 1.52x | 9.304 | 9.597 | 0.97x |
| Q15 | 268.019 | 33.770 | 7.94x | 256.054 | 12.491 | 20.50x |
| Q16 | 18.215 | 11.620 | 1.57x | 14.332 | 11.040 | 1.30x |
| Q17 | 16.009 | 17.488 | 0.92x | 15.008 | 16.227 | 0.92x |
| Q18 | 0.028 | 0.019 | 1.43x | 0.000 | 0.000 | 1.06x |
| Q19 | 299.935 | 266.242 | 1.13x | 287.100 | 110.242 | 2.60x |
| Q20 | 0.033 | 0.019 | 1.76x | 0.000 | 0.000 | 2.42x |
| Q21 | 16.363 | 2.930 | 5.59x | 0.070 | 0.079 | 0.89x |
| Q22 | 0.141 | 0.195 | 0.72x | 0.068 | 0.079 | 0.87x |
| Q23 | 23.592 | 4.176 | 5.65x | 0.085 | 0.098 | 0.86x |
| Q24 | 0.144 | 0.193 | 0.75x | 0.069 | 0.078 | 0.89x |
| Q25 | 0.074 | 0.022 | 3.32x | 0.000 | 0.000 | 1.97x |
| Q26 | 0.034 | 0.016 | 2.09x | 0.000 | 0.000 | 2.03x |
| Q27 | 0.044 | 0.020 | 2.26x | 0.000 | 0.000 | 2.13x |
| Q28 | 257.862 | 28.305 | 9.11x | 239.039 | 6.701 | 35.67x |
| Q29 | 261.861 | 71.663 | 3.65x | 250.627 | 48.709 | 5.15x |
| Q30 | 7.665 | 6.203 | 1.24x | 6.241 | 5.331 | 1.17x |
| Q31 | 255.618 | 31.437 | 8.13x | 243.775 | 10.141 | 24.04x |
| Q32 | 258.134 | 33.690 | 7.66x | 245.997 | 12.329 | 19.95x |
| Q33 | 564.164 | 342.155 | 1.65x | 545.320 | 177.259 | 3.08x |
| Q34 | 344.261 | 65.345 | 5.27x | 333.862 | 41.039 | 8.14x |
| Q35 | 343.479 | 63.843 | 5.38x | 335.369 | 41.622 | 8.06x |
| Q36 | 47.324 | 29.850 | 1.59x | 32.149 | 26.041 | 1.23x |
| Q37 | 38.597 | 7.748 | 4.98x | 0.739 | 0.658 | 1.12x |
| Q38 | 1.260 | 1.223 | 1.03x | 0.515 | 0.463 | 1.11x |
| Q39 | 0.977 | 0.900 | 1.08x | 0.251 | 0.261 | 0.96x |
| Q40 | 1.775 | 1.670 | 1.06x | 1.060 | 0.936 | 1.13x |
| Q41 | 0.918 | 0.835 | 1.10x | 0.222 | 0.236 | 0.94x |
| Q42 | 0.982 | 0.822 | 1.19x | 0.239 | 0.248 | 0.97x |
| Q43 | 1.948 | 1.458 | 1.34x | 0.811 | 0.733 | 1.11x |
Simplyblock and PostgreSQL
Simplyblock’s storage layer dramatically improves PostgreSQL performance in both raw and indexed query scenarios.
With no indexes, query execution was up to 5000x faster, and overall query runtime was reduced by 18x on average.
Even with indexes (where storage bottlenecks are less prominent), Simplyblock still reduced query time by up to 20x and cold-start load times by 47%.
🦆 DuckDB: Single File vs Partitioned Parquet
Test Scenarios:
- DuckDB reading a single Parquet file
- DuckDB reading partitioned Parquet files
- Each was tested against the provided baseline with a simplyblock-backed storage
Key Observations:
| System | Load Time | Benchmark Runtime |
| DuckDB (single Parquet) | 102 s | 7.78 s |
| Simplyblock+DuckDb (single Parquet) | 54 s | 8.10 s |
| DuckDB (partitioned Parquet) | – | 11.82 s |
| Simplyblock+DuckDB (partitioned Parquet) | – | 10.64 s |
✅ DuckDB is very high performance across all tests and independent of the underlying storage. However, simplyblock-backed DuckDB showed faster data load times, slightly faster cold queries, and sustained competitive warm-query latencies, even in more demanding partitioned workloads.
✅ Simplyblock increases query speed on cold benchmark runs by up to 27x.
ClickBench Results: DuckDB with Single Parquet File

When using DuckDB on top of simplyblock, cold queries are accelerated by up to 26x and showed mild improvements in warm query times (~1.1–2x).
This shows that simplyblock enhances first-time access (e.g., initial analytics or scans), which is often bottlenecked by storage in columnar file formats like Parquet.
This is especially interesting in the context of massive data sets where data typically doesn’t fit into memory and need to be read from the backing storage (being a cold-read). Simplyblock ensures fast and consistent access times no matter if data is already in RAM or still on disk.
| Query | DuckDB (cold) | SB + DuckDB (cold) | Rel. Speed | DuckDB (warm) | SB + DuckDB (warm) | Rel. Speed |
|---|---|---|---|---|---|---|
| Q01 | 0.044 | 0.026 | 1.69x | 0.001 | 0.001 | 1.00x |
| Q02 | 0.172 | 0.077 | 2.23x | 0.008 | 0.006 | 1.33x |
| Q03 | 1.984 | 0.108 | 18.37x | 0.017 | 0.014 | 1.21x |
| Q04 | 1.571 | 0.100 | 15.71x | 0.018 | 0.016 | 1.16x |
| Q05 | 1.674 | 0.536 | 3.12x | 0.148 | 0.138 | 1.07x |
| Q06 | 1.899 | 0.512 | 3.71x | 0.138 | 0.112 | 1.24x |
| Q07 | 0.108 | 0.065 | 1.66x | 0.013 | 0.012 | 1.04x |
| Q08 | 0.481 | 0.086 | 5.59x | 0.008 | 0.006 | 1.36x |
| Q09 | 2.738 | 0.622 | 4.40x | 0.156 | 0.173 | 0.90x |
| Q10 | 4.253 | 0.762 | 5.58x | 0.186 | 0.185 | 1.01x |
| Q11 | 2.291 | 0.336 | 6.82x | 0.070 | 0.036 | 1.96x |
| Q12 | 2.922 | 0.360 | 8.12x | 0.067 | 0.036 | 1.89x |
| Q13 | 2.238 | 0.702 | 3.19x | 0.127 | 0.109 | 1.17x |
| Q14 | 3.923 | 0.843 | 4.65x | 0.266 | 0.253 | 1.05x |
| Q15 | 2.841 | 0.597 | 4.76x | 0.142 | 0.128 | 1.11x |
| Q16 | 1.111 | 0.514 | 2.16x | 0.155 | 0.124 | 1.25x |
| Q17 | 3.845 | 1.050 | 3.66x | 0.354 | 0.248 | 1.43x |
| Q18 | 3.830 | 0.946 | 4.05x | 0.314 | 0.230 | 1.36x |
| Q19 | 7.164 | 1.585 | 4.52x | 0.463 | 0.463 | 1.00x |
| Q20 | 0.322 | 0.084 | 3.83x | 0.007 | 0.003 | 2.17x |
| Q21 | 15.114 | 0.567 | 26.66x | 0.090 | 0.122 | 0.74x |
| Q22 | 16.978 | 0.790 | 21.49x | 0.233 | 0.113 | 2.05x |
| Q23 | 25.856 | 1.373 | 18.83x | 0.307 | 0.197 | 1.56x |
| Q24 | 2.831 | 0.269 | 10.52x | 0.040 | 0.058 | 0.69x |
| Q25 | 1.001 | 0.122 | 8.20x | 0.022 | 0.027 | 0.83x |
| Q26 | 1.332 | 0.108 | 12.33x | 0.072 | 0.025 | 2.94x |
| Q27 | 1.254 | 0.121 | 10.36x | 0.025 | 0.022 | 1.14x |
| Q28 | 15.589 | 0.684 | 22.79x | 0.174 | 0.088 | 1.98x |
| Q29 | 11.829 | 3.981 | 2.97x | 1.410 | 3.056 | 0.46x |
| Q30 | 0.378 | 0.100 | 3.78x | 0.024 | 0.026 | 0.92x |
| Q31 | 7.071 | 0.731 | 9.67x | 0.113 | 0.105 | 1.08x |
| Q32 | 9.643 | 0.807 | 11.95x | 0.219 | 0.129 | 1.70x |
| Q33 | 7.354 | 1.767 | 4.16x | 0.597 | 0.545 | 1.10x |
| Q34 | 15.067 | 1.531 | 9.84x | 0.738 | 0.502 | 1.47x |
| Q35 | 14.977 | 1.516 | 9.88x | 0.693 | 0.502 | 1.38x |
| Q36 | 0.743 | 0.560 | 1.33x | 0.263 | 0.139 | 1.90x |
| Q37 | 0.119 | 0.095 | 1.25x | 0.023 | 0.034 | 0.69x |
| Q38 | 0.089 | 0.085 | 1.05x | 0.009 | 0.020 | 0.45x |
| Q39 | 0.104 | 0.088 | 1.18x | 0.010 | 0.024 | 0.42x |
| Q40 | 0.168 | 0.132 | 1.27x | 0.054 | 0.055 | 0.98x |
| Q41 | 0.099 | 0.081 | 1.22x | 0.005 | 0.011 | 0.41x |
| Q42 | 0.079 | 0.077 | 1.03x | 0.006 | 0.012 | 0.46x |
| Q43 | 0.073 | 0.071 | 1.03x | 0.005 | 0.012 | 0.39x |
ClickBench Results: DuckDB with Partitioned Parquet Files

With partitioned Parquet files, simplyblock showed significant cold-query improvements, up to 22x. Warm-query speedups were smaller (~1.1–2x), and a few regressions were likely due to variance in CPU-bound operations.
For complex, partitioned datasets, faster storage helps DuckDB ingest and query data more efficiently, especially when cold-starting or scanning wide partitions in analytics pipelines.
Again, with increasing data set sizes, the chance that the required data is already in RAM decreases dramatically. Here is where simplyblock really shines and increases the load performance when cold-reads happen.
| Query | DuckDB (part, cold) | SB + DuckDB (part, cold) | Rel. Speed | DuckDB (part, warm) | SB + DuckDB (part, warm) | Rel. Speed |
|---|---|---|---|---|---|---|
| Q01 | 0.109 | 0.174 | 0.63x | 0.002 | 0.002 | 1.00x |
| Q02 | 0.087 | 0.128 | 0.68x | 0.018 | 0.014 | 1.33x |
| Q03 | 0.107 | 0.141 | 0.76x | 0.024 | 0.023 | 1.04x |
| Q04 | 0.329 | 0.155 | 2.12x | 0.026 | 0.022 | 1.18x |
| Q05 | 1.026 | 0.550 | 1.87x | 0.161 | 0.132 | 1.22x |
| Q06 | 0.831 | 0.492 | 1.69x | 0.175 | 0.158 | 1.10x |
| Q07 | 0.067 | 0.108 | 0.62x | 0.018 | 0.014 | 1.29x |
| Q08 | 0.101 | 0.139 | 0.73x | 0.027 | 0.026 | 1.04x |
| Q09 | 0.677 | 0.555 | 1.22x | 0.175 | 0.164 | 1.07x |
| Q10 | 1.019 | 0.636 | 1.60x | 0.198 | 0.150 | 1.32x |
| Q11 | 0.397 | 0.310 | 1.28x | 0.047 | 0.049 | 0.96x |
| Q12 | 0.944 | 0.311 | 3.04x | 0.052 | 0.049 | 1.06x |
| Q13 | 1.249 | 0.665 | 1.88x | 0.190 | 0.158 | 1.20x |
| Q14 | 2.194 | 0.867 | 2.53x | 0.338 | 0.296 | 1.14x |
| Q15 | 0.852 | 0.698 | 1.22x | 0.169 | 0.173 | 0.98x |
| Q16 | 0.428 | 0.583 | 0.73x | 0.275 | 0.127 | 2.17x |
| Q17 | 2.098 | 0.966 | 2.17x | 0.351 | 0.250 | 1.41x |
| Q18 | 2.142 | 1.227 | 1.75x | 0.439 | 0.242 | 1.82x |
| Q19 | 4.160 | 1.627 | 2.56x | 0.771 | 0.508 | 1.52x |
| Q20 | 0.159 | 0.138 | 1.15x | 0.018 | 0.016 | 1.13x |
| Q21 | 9.590 | 0.483 | 19.86x | 0.252 | 0.244 | 1.03x |
| Q22 | 10.941 | 0.494 | 22.15x | 0.223 | 0.195 | 1.14x |
| Q23 | 19.398 | 0.879 | 22.07x | 0.612 | 0.410 | 1.49x |
| Q24 | 4.920 | 0.682 | 7.21x | 1.049 | 0.267 | 3.93x |
| Q25 | 0.177 | 0.212 | 0.83x | 0.078 | 0.076 | 1.02x |
| Q26 | 1.245 | 0.261 | 4.77x | 0.077 | 0.074 | 1.04x |
| Q27 | 0.204 | 0.173 | 1.18x | 0.110 | 0.067 | 1.65x |
| Q28 | 9.996 | 0.495 | 20.19x | 0.229 | 0.201 | 1.14x |
| Q29 | 8.748 | 3.691 | 2.37x | 2.013 | 3.635 | 0.55x |
| Q30 | 0.112 | 0.143 | 0.78x | 0.026 | 0.028 | 0.93x |
| Q31 | 2.173 | 0.623 | 3.49x | 0.175 | 0.173 | 1.01x |
| Q32 | 5.730 | 0.746 | 7.68x | 0.297 | 0.184 | 1.62x |
| Q33 | 4.566 | 1.503 | 3.04x | 0.831 | 0.595 | 1.39x |
| Q34 | 9.638 | 1.578 | 6.11x | 0.928 | 0.712 | 1.30x |
| Q35 | 9.759 | 1.700 | 5.74x | 0.789 | 0.657 | 1.20x |
| Q36 | 0.369 | 0.601 | 0.61x | 0.278 | 0.155 | 1.80x |
| Q37 | 0.176 | 0.185 | 0.95x | 0.079 | 0.081 | 0.98x |
| Q38 | 0.123 | 0.149 | 0.83x | 0.058 | 0.068 | 0.85x |
| Q39 | 0.141 | 0.156 | 0.90x | 0.037 | 0.039 | 0.95x |
| Q40 | 0.301 | 0.285 | 1.06x | 0.153 | 0.162 | 0.94x |
| Q41 | 0.102 | 0.110 | 0.93x | 0.018 | 0.020 | 0.92x |
| Q42 | 0.093 | 0.142 | 0.65x | 0.018 | 0.018 | 1.03x |
| Q43 | 0.091 | 0.140 | 0.65x | 0.020 | 0.020 | 1.03x |
Simplyblock and DuckDB
DuckDB, known for being compute-bound, saw modest but consistent improvements using simplyblock. However, when data doesn’t reside in memory yet, simplyblock’s extreme storage performance leads up to 27x faster cold queries, faster data loads, and lower latency for partitioned datasets.
DuckDB is fast by design, so differences were narrower. However, on cold starts (when data must be read from storage), simplyblock’s faster I/O showed a clear edge. It proves that even CPU-heavy analytics engines benefit from better storage in real-world conditions.
Simplyblock: Performance of Local Disks with the Flexibility of Distributed Storage
Simplyblock combines the performance of local NVMe disks with the flexibility of distributed storage. In all tests (PostgreSQL and DuckDB), it consistently performs better, particularly in I/O-heavy workloads.
The benchmarks validate that using simplyblock can dramatically reduce query runtimes, speed up ingestion, and make analytics pipelines far more efficient—whether in transactional databases or analytical engines.
The ClickBench benchmark results highlight the strength of simplyblock’s architecture in real-world data-intensive workloads.
- PostgreSQL, typically limited by I/O throughput on EBS volumes, benefited dramatically from the NVMe-backed, high-bandwidth simplyblock cluster.
- DuckDB workloads, while primarily CPU- and memory-bound, still saw tangible benefits in faster data loading and parallel query performance. Especially on the initial cold runs, where storage performance is the limiting factor in many situations.
Whether you’re scaling analytics pipelines or need predictable performance in transactional workloads, simplyblock provides the performance of local disks with the flexibility of distributed block storage, and can be deployed on your “cloud” of choice (public, private, or on-premises) without vendor lock-in.
Bring your data infrastructure to the modern age with simplyblock.

