When we talk about storage performance, we typically think of IOPS and throughput. In the best case, we also talk about average or best-case access latency. However, tail latency, the high-percentile end of the latency distribution, is crucial for providing predictable and consistent performance.
Tail latency refers to the 95th, 99th, and 99.9th percentiles on the latency distribution scale. And the 99th percentile provides the latency experienced by the worst 1% of all operations.
Unfortunately, these high-end percentiles are rarely taken seriously because they are so rare. It’s the typical issue of “it happens so rarely, who even cares if a request, once in a while, takes a bit longer?” However, the difference between 100 μs and 100 ms might break software, or at least SLAs. And “once in a while” on 10 million requests may still come up to 100,000 requests (99th percentile of 10 million) experiencing bad latencies, which will accumulate over multiple layers.
The Microservices Call Chain

Call chains, sometimes also called serial chains, describe patterns where operations happen serially in a chain. This is typical for microservices architectures where services call services that call services, which in itself call services and…, you get the idea.
With every additional layer of service calls, the likelihood of encountering one or more bad tail latencies somewhere in the stack increases. Introducing a new service layer, somewhere deep in the stack (like a database), can cause SLA breaches at higher levels.
In his blog post “Tail Latency Might Matter More Than You Think”, Marc Brooker explains that the variance of hitting tail latencies increases by a factor of 25 for each additional call in the chain.
However, you say “my microservices are stateless” and would follow up with “I rarely hit storage in any of my services.” But no worries, eventually, there are stateful services in the stack. Way down below. Databases, log files, lookup data in CSV files, and whatnot. If you call just a few such services, you will see high tail latencies. In your service.
Root Cause: Storage Systems
Stateful services can experience high tail latencies for a variety of reasons. These issues can be as simple as a scheduled background maintenance task, disk-write amplification, a noisy neighbor, or network congestion on a shared storage backend. Those events may impact just a small fraction of I/O operations, but when they do, latency jumps dramatically.
The worst cases, however, are sudden spikes in I/O operations. These events are similar to a noisy neighbor, but often relate to maintenance operations, such as background data scrubbing or increased metadata updates on large write batches.
Regardless of the cause, these disruptions increase access latency for some (or in the worst scenarios, all) I/O operations, leading to tail latency spikes. While modern NVMe and SATA / SAS SSDs aren’t as prominent targets for this type of issue as spinning roster, they still experience I/O bottlenecks if you force them to. And databases, such as PostgreSQL, can be “IOPS monsters”.
Monitoring and Quantifying Tail Latencies
I hope that most companies already collect and monitor latencies. However, these are often limited to one or two numbers: the 50th percentile (more commonly known as the median) and the maximum latency observed in a specific period.
If you are not collecting them yet, it’s straightforward to get started. Virtually all modern observability tools like Prometheus, DataDog, Dynatrace, and others offer histograms. A histogram allows you to retrieve values such as the 50th, 95th, 99th, and 99.9th percentiles. Don’t go overboard. These four numbers are enough. From my perspective, the maximum latency isn’t necessary, but may be required for you, depending on contractual service SLAs.
While this advice isn’t exclusive to storage systems, it is particularly critical there. Monitoring must be end-to-end, not just at the disk level.
In storage architectures built on erasure‑coded object stores or sharded KV systems, tail latency can arise at multiple layers, so observability must encompass the application, network, and storage subsystems holistically. The deeper your application stack, the deeper the trace.
P.S.: A holistic observability trace can help you find the component that is the root cause of the high tail latency and remove a lot of “poking in the dark.”
Reduce Storage Tail Latency
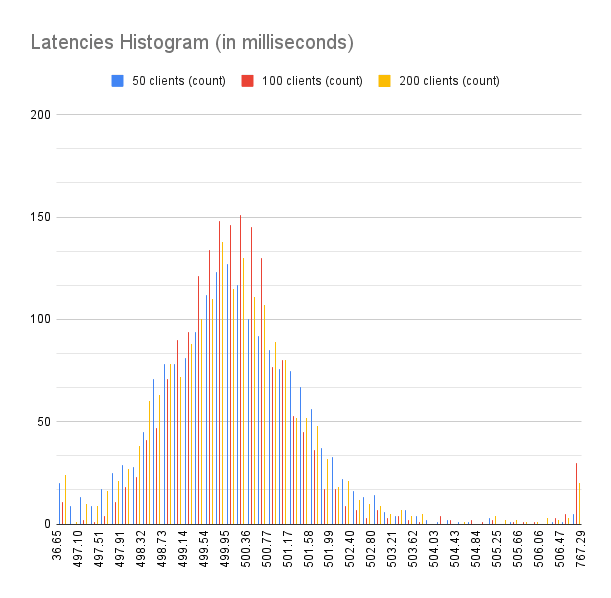
The easiest way to reduce tail latency on the storage level is to employ a storage system that provides a highly consistent latency. Remember that consistent doesn’t have to mean “the fastest. At simplyblock, we might be biased, but our own performance tests collect all latencies and show the latency distribution. Users love that. It gives them confidence that it doesn’t just show the “good parts” of the benchmark, but all of it. That said, simplyblock provides a consistent low access latency and scales almost linearly if it reaches a bottleneck.
Apart from that, there are a few other strategies to improve the tail latency of your storage and dependent systems.
Hedged or Backup Reads
One practical approach is the hedged request: launch a second copy of a read if your first hasn’t returned by a threshold (e.g., 95th percentile).
This trades extra load for reduced tail time. Hedged requests are modal. You either repeat a request or you don’t. Albeit, they are simple and effective when rare slow paths dominate tail behavior.
Erasure Coding to the Rescue
Erasure coding offers flexible configuration options. Imagine you split and store your data in multiple individual shards, and you also write parity shards to ensure the data is reconstructable if one of the data shards is lost.
When the storage engine wants to reconstruct your data on request, it issues a read request for all individual data shards. If a threshold is reached and not all shard requests have returned yet, it can use backup reads via parity shards. This can improve the overall tail latency.
Redundant Parallel Queries in Distributed Stores
In distributed key‑value stores, it’s sometimes effective to send multiple redundant reads and use the fastest response.
Studies show that at the 99.9th percentile, reading from two replicas instead of one can be up to 17x faster, at the cost of extra read load.
Optimizing Maintenance Workloads
Background jobs, such as compaction, replication, or backups, often collide with foreground I/O.
Ideally, these types of operations should be scheduled during low traffic hours. If this isn’t possible, throttle them adaptively so they don’t saturate shared paths.
Without careful scheduling, those maintenance operations are a primary cause of tail‑end spikes.
Tail Latency is a Signal, Not the Noise
Tail latency in storage operations is not a statistical afterthought. It’s a critical determinant of system performance, user satisfaction, and business outcome.
If 99% of operations are fast, but 1% lag, it’s that 1% that your users will remember. These delays can cause clients to be upset, SLAs to be violated, and conversion rates to decrease. If you imagine 10,000 users, each with an average transaction value of $1,000, that would leave around $100,000 on the table if these 1% abandon their transaction due to tail latency.
Taming the tail means:
- Carefully designing stack layers to expect and handle outliers.
- Monitoring high-percentile latencies, not just averages.
- Using techniques like hedged or redundant calls, employing erasure coding, implementing sharding, and scheduling I/O-heavy operations outside of peak hours.
In general, accept that a little extra cost or complexity can get you a massive increase in performance predictability.
Tail latency may be rare, but its impact is outsized—especially in modern, distributed systems. When things go wrong at the tail, the consequences ripple across your application stack, your users, and your bottom line.
If you are looking for a simpler solution with less variation in latency on the storage layer, simplyblock offers a distributed storage platform with predictable low latency, virtually unlimited IOPS, and throughput constrained only by networking capacity. Learn more about simplyblock.
Because at the end of the day, you can calculate the perfect average latency, but if your tail is jagged and high, your users will notice. And they won’t like it.