CSI Node Plugin
Terms related to simplyblock
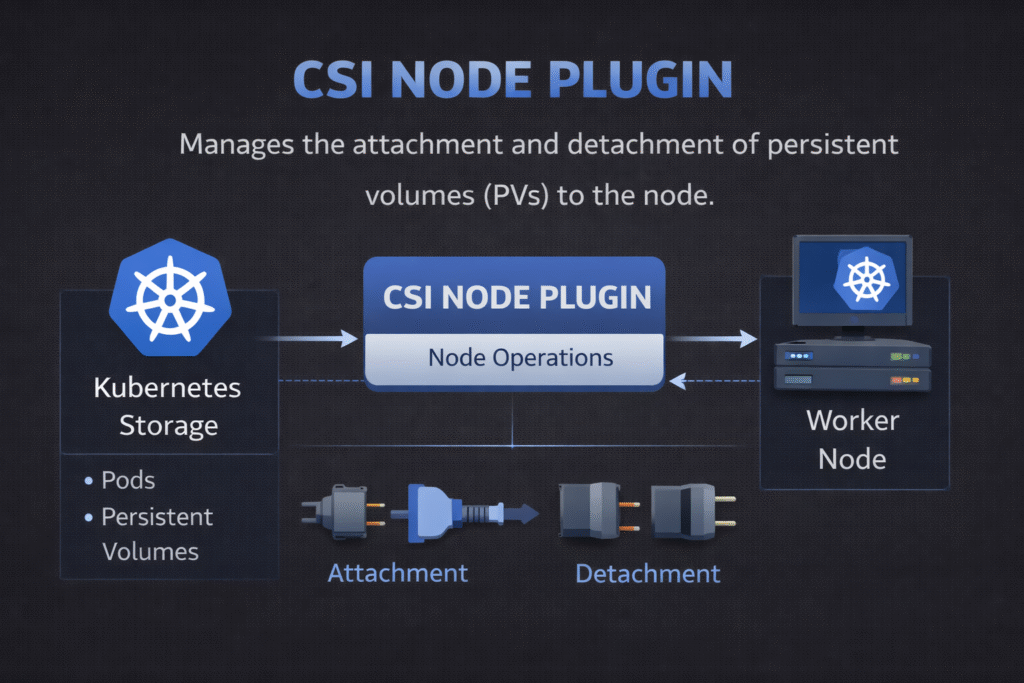
A CSI Node Plugin runs on each Kubernetes worker node and carries out node-side storage tasks. It mounts volumes into pods, unmounts them on shutdown, and reports node capabilities back to Kubernetes. When teams talk about “pods stuck in ContainerCreating,” the node path often holds the answer.
Kubernetes Storage depends on this component because every stateful pod needs a working mount path. NVMe/TCP backends raise expectations for low latency, so mount speed, CPU cost, and tail latency all matter more. Software-defined Block Storage can help when it keeps the I/O path efficient and enforces predictable behavior under multi-tenant load.
Why Node-Side Storage Logic Drives Platform Reliability
The controller side of CSI decides what volume to create. The node side decides whether the pod actually starts. That difference shapes outage patterns. A slow provisioner delays deployments. A slow mount blocks pods during rollouts, drains, or reschedules.
Node-side issues also scale with cluster size. Each node runs its own plugin, so small problems repeat many times. A single mis-set mount option can add seconds to every pod start. A cleanup bug can leave stale mounts behind and force manual work during incidents.
🚀 Reduce CSI Node Plugin Mount Time for Stateful Pods
Use simplyblock to deliver NVMe/TCP volumes with steady attach and mount behavior at scale.
👉 Use simplyblock for Kubernetes Storage →
CSI Node Plugin Lifecycle – Stage, Publish, and Unpublish
Kubernetes and kubelet trigger a clear sequence of steps on the node. The node plugin prepares the device, maps it into a stable path, and mounts it into the pod.
A typical flow looks like this:
First, the node plugin “stages” the volume to a path on the node. Next, it “publishes” the volume into the pod’s mount namespace. Later, it “unpublishes” the volume when the pod stops. After that, it unstages the volume and releases the device mapping.
In practice, these steps break for a few repeatable reasons. Device discovery can lag. Permissions can drift. Mount flags can conflict with filesystem settings. Cleanup can fall behind when many pods churn at once.
How Node Components Tie Into Kubernetes Storage
Kubelet orchestrates the local workflow. It watches pod specs, calls the CSI node interface, and updates pod status based on success or failure. That means node-side storage behavior shows up as app-facing availability, not as a background detail.
Scheduling and topology also matter at the node level. If Kubernetes places a pod on a node that cannot access the volume, attach and mount will fail. If a pod lands “far” from the backing storage, latency will spike even when the mount works. Strong placement rules and consistent labels reduce this risk, especially in multi-zone clusters.
CSI Node Plugin on NVMe/TCP Fabrics
NVMe/TCP gives you NVMe-oF semantics over standard Ethernet. It often fits as a SAN alternative because teams can scale it without special-purpose fabrics everywhere.
The CSI node plugin still owns the mount lifecycle, but the backend design decides the data-path cost. If the stack burns CPU per I/O, the node runs hot during peak load. If the stack adds extra memory copies, tail latency tends to widen under contention.
A user-space, SPDK-style I/O path can reduce overhead because it avoids work that does not move data forward. That efficiency matters when you run many stateful pods per node and want stable p99 latency during churn.
Testing Mount Time, Tail Latency, and CPU Cost
Benchmarking node behavior needs two views: lifecycle timing and steady-state I/O.
Start with lifecycle timing. Measure time from pod scheduled to volume mounted. Track failures in the publish and unpublish steps. Compare results during normal ops and during disruptive events like node drains.
Then measure steady-state I/O. Focus on p95 and p99 latency, not just throughput. Capture CPU usage on the node while the workload runs, because node plugins can amplify overhead when they interact with device setup and mount paths.
For realistic results, test with concurrency that matches production. Also, run a rolling restart during the test, so you see how mounts behave under pressure.
Fixing Slow Mounts and Cleanup Loops
This checklist stays short on purpose. It’s the only list on the page.
- Standardize mount options per StorageClass, and keep them stable across clusters.
- Confirm device discovery and multipath settings on every node image.
- Limit bursty reschedules during maintenance windows to reduce mount storms.
- Validate topology labels and node taints so pods land where volumes can attach fast.
- Watch node-level CPU during I/O peaks, and flag regressions after upgrades.
- Test unpublish and unmount paths during chaos events, not only during clean shutdowns.
CSI Node Plugin Deployment Models Compared
The table below compares node plugin patterns you will see in production. Use it as a quick way to align Kubernetes Storage goals with operational effort.
| Model | What teams like | What can bite you | Best fit |
|---|---|---|---|
| Default DaemonSet node plugin | Simple rollout per node | Drift across node images | Smaller fleets, stable node OS |
| Managed node plugin + tight node images | Repeatable behavior | Requires stricter image control | Regulated or high-uptime teams |
| Topology-driven placement rules | Fewer cross-zone surprises | Needs label discipline | Multi-zone production clusters |
| NVMe/TCP backend with QoS | Better tail latency under load | Needs fabric and QoS tuning | Multi-tenant platforms, databases |
CSI Node Plugin Performance with Simplyblock™
Simplyblock™ supports Kubernetes Storage with NVMe/TCP and an efficient data path designed for low overhead. That focus helps when node-side CPU and tail latency limit how many stateful pods you can safely pack onto each worker.
Simplyblock also fits Software-defined Block Storage operating models that matter to platform teams. You can apply policy, isolate noisy neighbors, and keep performance more consistent during churn. Those controls reduce the gap between “it worked in testing” and “it stayed stable during upgrades.”
Where Node-Side Storage Goes Next
Expect tighter links between scheduling, topology, and storage health signals. Teams want Kubernetes to make fewer “bad placements” by default, especially for stateful services.
Hardware offload will also shape node behavior. DPUs and IPUs can reduce host CPU use for parts of the storage path. Even with offload, the software stack still decides efficiency end-to-end, so clean node-side lifecycle code stays critical.
Related Terms
Teams often review these glossary pages alongside the CSI Node Plugin when they standardize Kubernetes Storage and Software-defined Block Storage.
- CSI Driver vs Sidecar
- IO Path Optimization
- Zero-Copy I/O
- CSI Topology Awareness
- Kubernetes NodeUnpublishVolume
Questions and Answers
The CSI Node Plugin is responsible for node-level storage operations such as mounting, formatting, and unmounting volumes. It runs on every node where workloads may access storage, enabling low-latency access and ensuring compatibility with Simplyblock’s high-throughput block volumes.
The Controller Plugin manages cluster-wide actions like volume creation and snapshotting, while the Node Plugin handles tasks specific to the local node. Together, they enable seamless integration of Kubernetes-native storage into any workload.
Yes. For pods to access and mount volumes, the Node Plugin must run on all nodes in the cluster. It ensures volumes are mounted properly, formatted if needed, and unmounted on pod termination—critical for stateful workloads like databases or analytics jobs.
Absolutely. Inefficient or misconfigured node plugins can introduce latency or mount delays. Simplyblock’s CSI implementation is optimized for fast NVMe devices and leverages low-overhead protocols like NVMe over TCP to ensure consistent performance at the node level.
Track metrics like mount time, IO errors, and plugin health across nodes. Use Kubernetes events and node logs to identify plugin issues early. Simplyblock integrates with observability platforms to surface CSI Node Plugin behavior in real time.