Storage Metrics in Kubernetes
Terms related to simplyblock
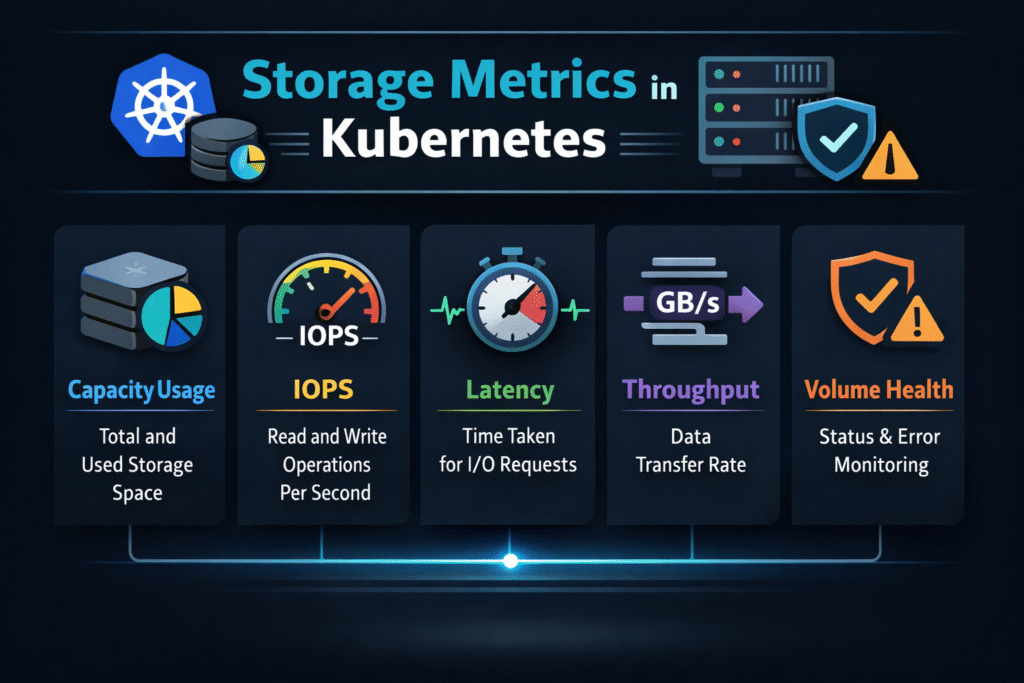
Storage metrics in Kubernetes describe how fast, how steady, and how safely your apps read and write data. They help you spot noisy neighbors, bad placement, weak network paths, and storage pool pressure before users notice.
Executives care because storage issues show up as missed SLOs, higher cloud bills, and slower product delivery. DevOps and IT Operations care because storage metrics shorten incident time and make capacity plans real.
Most teams get value from storage metrics when they tie each metric to a decision. Track less, but act more.
Turning Storage Data Into Fast Decisions With Policy and Automation
Raw charts do not fix storage. Clear thresholds, alerts, and runbooks do. Strong teams pick a small set of “decision metrics,” then wire them into workflows.
Start with these three questions and map each one to a metric set:
How long does I/O take when the load rises?
How much work does the platform complete per second?
Which workload causes the pain, and where does it run?
When you run Kubernetes Storage at scale, you also need a shared language across teams. That is where Software-defined Block Storage helps, because it gives you one control plane for pools, volumes, multi-tenancy, and QoS, even when clusters differ.
🚀 Monitor Kubernetes Storage Metrics for NVMe/TCP Volumes
Use Simplyblock to capture I/O stats, cluster health, and QoS signals in one workflow.
👉 View Simplyblock Monitoring for Kubernetes Storage →
Storage Metrics in Kubernetes – The Signal Map That Matters Most
Teams often track too many numbers and still miss the root cause. A better approach groups metrics into five “signal families,” then connects each family to a common failure mode. Latency signals show user impact first. Track p50, p95, and p99, not just averages. Watch, read, and write latency separately, because apps stress them in different ways.
IOPS and throughput signals show load and headroom. A healthy system can deliver both, but each workload leans on one more than the other. Databases often push IOPS. Streaming jobs can push throughput.
Queue and saturation signals show a hidden backlog. When queues rise, latency follows. When saturation stays high, you can’t “tune” your way out. Error and retry signals show risk. Timeouts, failed mounts, and retry storms often look like app bugs until you line them up with storage events. Capacity and pool signals show tomorrow’s incidents. Thin pools, hot tiers, and uneven device wear show up here long before a volume fills.
Storage Metrics in Kubernetes on NVMe/TCP – What Changes on the Data Path
NVMe/TCP gives you NVMe semantics over standard Ethernet, so it fits well in baremetal and mixed environments. It also shifts what “good” looks like. Network health starts to matter as much as device health. Packet loss, jitter, and bad routing can raise tail latency, even when the drives look fine.
CPU cost matters too. If your storage stack burns CPU per I/O, you lose pod density and waste nodes. SPDK-style user-space paths often reduce that overhead, which helps when clusters run at high concurrency. Use NVMe/TCP metrics alongside storage metrics, not instead of them. The best teams correlate them in one view.
Benchmarking Storage Metrics in Kubernetes Without Fooling Yourself
Benchmarks work only when they match your real load. Many teams run a single-pod test and call it “done.” That hides contention, reschedules, and shared network paths. Set a clear test goal. Measure “steady state” for normal load, then measure “stress state” for peak load. Capture latency percentiles during both.
Run tests during the events that break storage in production. Drain a node. Roll a deployment. Scale a StatefulSet. Reschedule pods across zones. Those actions often change performance more than a raw I/O test.
Use one list of checks so teams run the same playbook each time:
- Match pod count, block size, and read/write mix to real workloads
- Test with realistic concurrency, not one worker
- Record p95 and p99 latency, plus IOPS and throughput
- Log the CSI attach and mount time during scale events
- Repeat tests at peak traffic hours to expose contention
How Common Metric Sources Compare for Kubernetes Storage Visibility
Different data sources answer different questions. The table below shows what each one does best and where it falls short.
| Metric source | What it explains well | What it misses | Best use |
|---|---|---|---|
| Application metrics | User impact and query time | Storage root cause | SLO and app tuning |
| Kubernetes and CSI events | Attach, mount, reschedule timing | Deep I/O behavior | Fast triage during incidents |
| Node-level OS metrics | CPU, network, and basic disk stats | Multi-tenant volume detail | Spot host pressure and noise |
| Storage backend metrics | Pool health, volume QoS, device wear | App context | Capacity, QoS, and planning |
Storage Metrics in Kubernetes With Simplyblock™ – Predictable I/O Under Mixed Load
Simplyblock™ targets predictable performance by combining Software-defined Block Storage with NVMe/TCP and an SPDK-based, user-space dataplane. That approach helps when you run mixed workloads, such as databases, analytics jobs, and CI pipelines, on the same Kubernetes Storage platform.
Simplyblock adds multi-tenancy and QoS so teams can cap noisy neighbors instead of “hoping” they behave. It also supports hyper-converged, disaggregated, and hybrid setups, which lets platform teams keep one operating model while cluster shapes change.
In practice, you want the same outcome every day: stable p99 latency, clear headroom signals, and fast fault isolation. Metrics should point to action, not debate.
Where Kubernetes Storage Observability Is Going Next
Teams will keep pushing for fewer blind spots. Expect tighter links between storage telemetry and scheduling decisions. Expect more policy-driven controls that turn metrics into guardrails.
Hardware offload will also shape the next wave. DPUs and IPUs can move parts of the data path away from the host CPU, which can improve efficiency and reduce jitter. The best platforms will treat offload as an option, not a requirement.
Related Terms
Teams often review these glossary pages alongside Storage Metrics in Kubernetes when they define alerts for Kubernetes Storage and Software-defined Block Storage.
Storage Quality of Service
Observability
SmartNIC vs DPU vs IPU
Storage High Availability
Kubernetes Capacity Tracking for Storage
Questions and Answers
Storage metrics in Kubernetes are critical for tracking volume usage, performance, and health across pods and nodes. For example, metrics like capacity, IOPS, and latency help optimize workloads running on Kubernetes Stateful workloads, where persistent data access is essential.
You can monitor performance using CSI metrics, kubelet stats, and Prometheus integrations. These insights are especially useful when running applications on block storage replacement solutions that benefit from detailed I/O-level observability and dynamic tuning.
For workloads like databases, key metrics include volume capacity, inodes usage, IOPS, and per-operation latency. These are vital for ensuring performance and durability on platforms like PostgreSQL on Simplyblock, where storage directly impacts throughput.
Yes, CSI drivers can expose volume metrics through the csi-metrics endpoint. These metrics can be scraped by Prometheus and visualized, which is fully supported in Simplyblock’s Kubernetes CSI implementation for real-time monitoring.
By analyzing metrics like utilization and throughput, teams can right-size volumes, eliminate unused capacity, and detect inefficiencies. Simplyblock provides tooling to support optimizing Amazon EBS volumes cost, reducing expenses without sacrificing performance.