Storage Latency vs Throughput
Terms related to simplyblock
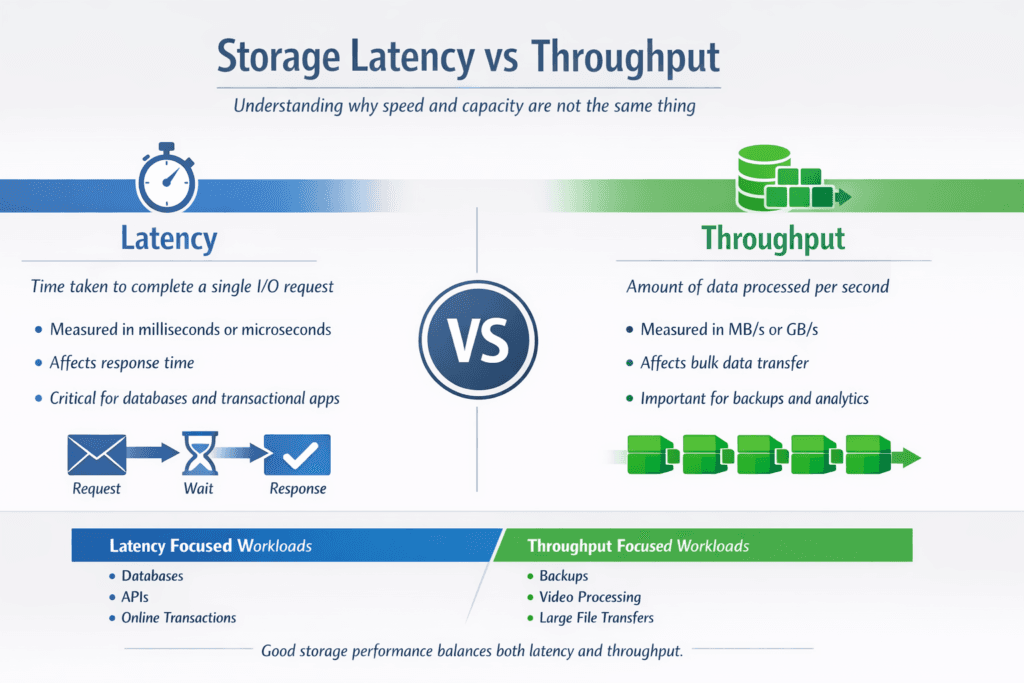
Storage latency measures how long a single I/O takes. Throughput measures how much data moves per second. Leaders often see both numbers on vendor sheets, but the business impact depends on the workload. OLTP databases, queues, and metadata-heavy apps feel latency first. Analytics scans, backups, and large ingest pipelines push on throughput first.
The trap is chasing one metric and breaking the other. If you push throughput by raising queue depth, you can also raise tail latency and slow user-facing calls. If you chase the lowest latency with tiny I/Os, you can cap throughput and waste NVMe bandwidth. In Kubernetes Storage, the tradeoff matters more because shared nodes, shared networks, and multi-team clusters can shift results from one rollout to the next. Software-defined Block Storage helps when it turns these goals into policy, not guesswork.
Tuning Latency and Throughput with Today’s Storage Stacks
A storage stack shapes both latency and throughput through its datapath, media, network, and background work. You can lower latency by shortening the I/O path, reducing context switches, and keeping CPU overhead stable at higher IOPS. You can raise throughput by improving parallelism, using larger block sizes for scan-heavy jobs, and keeping network and media queues full without pushing tail latency out of bounds.
For cloud-native platforms, the most useful approach treats latency and throughput as linked controls. Set latency targets (p95 and p99) for interactive services, then assign throughput targets for batch lanes. Use Software-defined Block Storage features such as QoS, workload isolation, and predictable rebuild behavior to keep those lanes from colliding.
🚀 Balance Latency and Throughput on NVMe/TCP, Natively in Kubernetes
Use simplyblock to set QoS guardrails, protect p99 latency, and still hit throughput targets at scale.
👉 Optimize Kubernetes Storage with NVMe/TCP →
Storage Latency vs Throughput in Kubernetes Storage
Kubernetes adds real-world friction that changes how latency and throughput behave. Pod placement can add network hops. CPU limits can throttle the initiator stack, which raises latency even when the storage media sits idle. Noisy neighbors can consume bandwidth and shift tail latency without changing the average.
Teams get better results when they benchmark inside the cluster and align results to storage policies. That means you test with the same CSI driver, the same node types, the same namespaces, and the same throttles that production uses. It also means you treat “fast” as “fast and steady,” since one unstable node can break the whole service SLO.
Storage Latency vs Throughput over NVMe/TCP
NVMe/TCP often becomes the baseline transport for disaggregated storage because it runs on standard Ethernet and keeps NVMe semantics end to end. It can deliver strong throughput at scale, but CPU and network design still decide where the curve bends.
If you push for maximum throughput, you may raise queue depth and increase parallel streams. That can improve bandwidth, yet it can also raise p99 latency when CPUs saturate or when packet pacing slips. If you push for minimum latency, you often keep queues smaller and tune for fast completions, but you may leave throughput on the table for scan-heavy jobs. A good platform makes both modes predictable, so a database lane does not inherit the tuning meant for backups.
Measuring Storage Latency vs Throughput in Benchmarks
Benchmarks work best when they match production patterns and report percentiles, not only averages. Use short runs to validate basic behavior, then use longer steady-state runs to expose jitter from background tasks, multi-tenancy, and network variance.
- Start with two profiles: one latency-sensitive (small blocks, random I/O) and one throughput-focused (large blocks, sequential I/O).
- Track p95 and p99 latency along with throughput, CPU, and network use, in the same time window.
- Sweep queue depth in small steps, and record the knee where latency climbs faster than throughput.
- Re-run the same tests after CSI updates, kernel updates, topology shifts, or policy changes, then compare deltas instead of single peaks.
In executive terms, the goal is simple: prove the platform can hold the latency target while it delivers the throughput target, under the same constraints your cluster runs every day.
Practical Ways to Improve Results Without Hiding the Problem
You get more value from stability than from a one-time peak. Keep background work predictable. Separate batch lanes from interactive lanes with QoS. Watch CPU headroom on initiators and targets, since CPU pressure often shows up as tail latency first.
Datapath efficiency matters. User-space, zero-copy designs reduce overhead and help keep latency steady when load rises. That stability supports higher sustained throughput because the system spends less time recovering from jitter and less time burning cycles per I/O. In Kubernetes, that also protects app CPU budgets, which keeps pods responsive during spikes.
Latency-First vs Throughput-First Storage Profiles
The table below shows how common tuning choices shift outcomes. Use it as a quick guide when you decide what “good” looks like for each workload class.
| Goal | Typical I/O shape | What improves | What can degrade | Best fit workloads |
|---|---|---|---|---|
| Latency-first | Small blocks, random, lower queue depth | p95/p99 latency, app response time | Peak throughput | OLTP databases, queues, metadata-heavy services |
| Throughput-first | Large blocks, sequential, higher parallelism | MB/s, ingest speed, scan speed | Tail latency under contention | Analytics scans, backups, ETL, bulk restore |
| Balanced lanes | Mixed profiles with QoS and isolation | Predictable SLOs across teams | Requires policy discipline | Shared Kubernetes platforms, multi-tenant clusters |
Performance Isolation for Multi-Team Kubernetes Platforms
Simplyblock™ targets predictable outcomes for mixed workloads by combining NVMe/TCP, Kubernetes Storage support, and Software-defined Block Storage controls. Teams can isolate lanes with QoS, reduce noisy-neighbor impact, and keep benchmarks repeatable across namespaces and clusters. That matters when one platform must serve databases and batch jobs at the same time.
Simplyblock also uses SPDK-based user-space design choices to reduce datapath overhead and improve CPU efficiency, helping stabilize tail latency under high concurrency. With hyper-converged, disaggregated, and hybrid deployments, teams can validate latency and throughput in the same topology they plan to run in production.
Future Improvements in Observability and Workload Replay
Storage teams increasingly tie performance checks to releases. They run small canaries inside Kubernetes, score results against p99 and throughput targets, and block rollouts when numbers drift. Workload replay also gains traction because it captures real burst patterns that synthetic tests miss.
Expect stronger links between telemetry and policy. Better observability will help teams separate “network-bound,” “CPU-bound,” and “media-bound” cases fast, then apply the right guardrails without trial-and-error.
Related Terms
Teams often review these alongside Storage Latency vs Throughput when they set targets for Kubernetes Storage and Software-defined Block Storage.
Questions and Answers
Storage latency refers to the time it takes to complete a single I/O operation, while throughput measures the total amount of data transferred over time. Latency impacts responsiveness; throughput affects how fast large volumes of data move. Both metrics are key to understanding overall performance.
It depends on your workload. Low-latency storage is critical for databases and real-time systems, where response time matters. High throughput is essential for tasks like backups, video processing, or analytics. Ideally, you want both, but tuning depends on the specific use case.
NVMe significantly reduces latency by using a streamlined protocol and a direct PCIe connection. It also boosts throughput with parallel queues and faster NAND flash. When deployed over TCP, NVMe retains low-latency and high-throughput benefits in networked environments.
Yes, using optimized protocols like NVMe over TCP, along with tuning queue depths and block sizes, can reduce latency while maintaining or even improving throughput. This balance is essential for workloads requiring both speed and responsiveness.
Use tools like FIO to simulate workloads and measure latency in microseconds and throughput in MB/s or GB/s. Run tests with varied block sizes and queue depths to understand how your system performs under real-world conditions.