Fio Storage Benchmark
Terms related to simplyblock
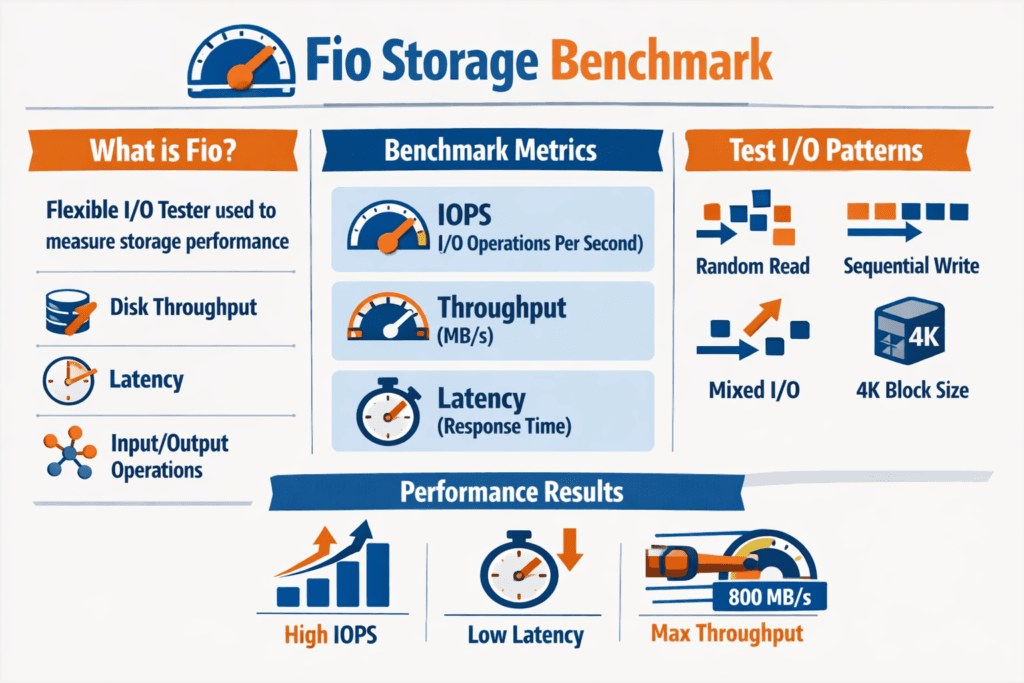
A fio Storage Benchmark uses Flexible I/O Tester (fio) to generate controlled read and write workloads, then reports IOPS, throughput (MB/s or GB/s), latency percentiles (p50, p95, p99), and CPU cost. fio helps because it models queue depth, block size, access pattern (random vs sequential), read/write mix, and concurrency in a repeatable way.
Executives use fio results to judge risk: tail latency that breaks SLOs, storage saturation that limits growth, and noisy-neighbor behavior that creates customer impact. DevOps and IT Ops teams use fio to isolate which layer drives the bottleneck: host CPU, kernel overhead, network path, CSI behavior, or backend contention. fio is most useful when your test reflects production, including the same volume type, the same storage class, the same read/write mix, and the same concurrency you expect at peak.
Reducing Benchmark Noise with SPDK and Software-defined Block Storage
Clean benchmarks start with a clean datapath. When the storage stack burns CPU on context switches, copies, and interrupts, fio results drift as load rises. SPDK moves storage processing to the user space and reduces kernel overhead, which often improves IOPS per core and tightens latency spread.
For Software-defined Block Storage, that matters because performance should scale with nodes, not collapse as you add tenants. A platform that pairs a user-space datapath with QoS controls can keep results stable across repeated test runs, even when multiple teams share the same cluster.
🚀 Run fio Storage Benchmarks on NVMe/TCP Volumes in Kubernetes
Use Simplyblock to standardize fio test profiles, cut benchmark variance, and validate p99 latency at scale.
👉 Use Simplyblock for Database Performance Optimization →
Fio Storage Benchmark in Kubernetes Storage
In Kubernetes Storage, teams usually run fio as a pod that targets a PVC. That validates the whole chain: CSI provisioning, node scheduling, network path, and the storage backend. Persistent Volumes and Persistent Volume Claims define how the application consumes storage, but the backend sets the real performance ceiling.
To keep tests meaningful, pin fio pods to specific nodes, set explicit CPU and memory limits, and match volume mode (filesystem vs raw block) to your application. If your database uses direct IO on raw devices, test the raw block. If your service writes small files through a filesystem, test that path. Kubernetes can add variance through rescheduling and shared node resources, so run multiple iterations and track latency percentiles, not only peak throughput.
Fio Storage Benchmark and NVMe/TCP
NVMe/TCP transports NVMe commands over standard Ethernet using TCP/IP, which fits common network designs and still supports high parallelism. When fio drives deeper queues, NVMe/TCP often shines on throughput and concurrency, while your tuning choices, such as MTU, RSS, IRQ affinity, and CPU pinning, influence tail latency.
NVMe/TCP also works well for Kubernetes because it aligns with routable IP networks and avoids special fabric requirements. If you also evaluate RDMA-based NVMe transports, fio helps you see whether your workload is latency-bound or concurrency-bound, then you can choose the transport that best matches the service.
Measuring and Benchmarking Fio Storage Benchmark Performance
A solid fio plan starts with workload intent. Define what you measure: OLTP-style random reads, log-style sequential writes, analytics reads, or a mixed profile. Then standardize your job file so every run stays comparable across environments.
Use a small baseline set of fio controls and keep them consistent across vendors, clusters, and test windows.
- Block size, read/write mix, ioengine, direct=1, iodepth, numjobs, runtime, and latency percentiles.
Approaches for Improving Fio Storage Benchmark Performance
Start by removing avoidable bottlenecks. Validate CPU headroom and NUMA alignment, because small placement errors can inflate p99 latency. Check that fio uses direct IO when you want device behavior rather than page cache behavior. Confirm your network path for NVMe/TCP, including MTU, routing, and congestion, because network variance shows up as tail latency.
Next, tune for the metric that maps to business impact. Many stacks boost average IOPS, but fewer protect p99 under mixed workloads and multiple tenants. That gap becomes obvious in Kubernetes when background jobs, rolling updates, and other pods share the same nodes.
Storage Paths Compared for Fio Test Results
The storage path you test shapes the numbers you get. The table below summarizes common patterns teams see when they run fio across different architectures.
| Storage path under test | Typical fio signal | Strength | Common limiter |
|---|---|---|---|
| Local NVMe (single node) | Highest single-host peak | Lowest latency on one host | No cluster scale, node failure domain |
| Traditional SAN / iSCSI | Stable but higher latency | Centralized operations | Protocol overhead, scaling cost |
| NVMe/TCP on Software-defined Block Storage | High concurrency, scalable | Uses standard Ethernet, scales out | Needs efficient datapath and QoS |
| NVMe/RDMA (RoCE) | Strong tail latency | Lowest latency at scale | Requires RDMA-capable fabric |
Stabilizing Fio Results with Simplyblock™ Performance QoS
Simplyblock™ targets stable results by combining an SPDK-based, user-space datapath with cloud-native controls. That design helps reduce kernel overhead, lowers CPU per I/O, and keeps throughput scaling predictable as you add nodes and tenants. For teams benchmarking Kubernetes Storage, this matters because the test should reflect the storage system, not scheduler noise or contention side effects.
Simplyblock™ also supports NVMe/TCP and NVMe/RoCEv2, which lets you match transport to workload. Multi-tenancy and storage QoS help limit noisy neighbors, so one team’s fio run does not distort another team’s latency profile. That level of control fits executive expectations for predictable service levels, and it gives operators the knobs to enforce them in production.
Where Storage Benchmarking Is Headed Next – User-Space IO and Offload
Benchmarking trends track infrastructure trends. User-space IO stacks such as SPDK keep gaining relevance because they reduce overhead and improve efficiency as device speeds rise. At the same time, offload options using DPUs and IPUs can move parts of the storage datapath away from application CPUs, which can tighten latency and free cores for workloads.
For storage teams, this shifts fio from a one-time test into an ongoing control loop: define a job file that matches a service, run it continuously or on a schedule, and alert when p99 drifts. That practice works best when your Software-defined Block Storage platform includes QoS, observability, and a predictable NVMe/TCP path.
Related Terms
These terms help teams interpret FIO results, control tail latency, and standardize benchmarking in Kubernetes Storage and Software-defined Block Storage.
- Storage Quality of Service (QoS)
- SPDK (Storage Performance Development Kit)
- NVMe over RoCE
- Dynamic Provisioning in Kubernetes
Questions and Answers
FIO (Flexible I/O Tester) is a popular tool for simulating storage workloads and measuring key metrics like IOPS, latency, and throughput. It’s ideal for benchmarking local disks, SANs, and protocols like NVMe over TCP in both bare-metal and Kubernetes environments.
A simple FIO test can be run with a command specifying read/write type, block size, I/O depth, and duration. For example, testing a 4KiB random read workload helps assess IOPS performance. These tests are crucial before and after tuning storage systems.
Key FIO parameters include iodepth, blocksize, rw, and numjobs. Changing these values simulates different real-world workloads. For NVMe benchmarking, high queue depths and small block sizes often reveal the system’s peak performance potential.
Yes, FIO can benchmark NVMe over TCP by targeting the remote block device exposed via the protocol. It helps measure the protocol’s true IOPS, latency, and throughput, and compare against older standards like iSCSI.
FIO outputs include metrics like bandwidth (throughput), IOPS, and latency in microseconds. Low latency with high IOPS indicates optimal performance. Understanding these outputs helps fine-tune both the storage backend and OS-level parameters for real workloads.