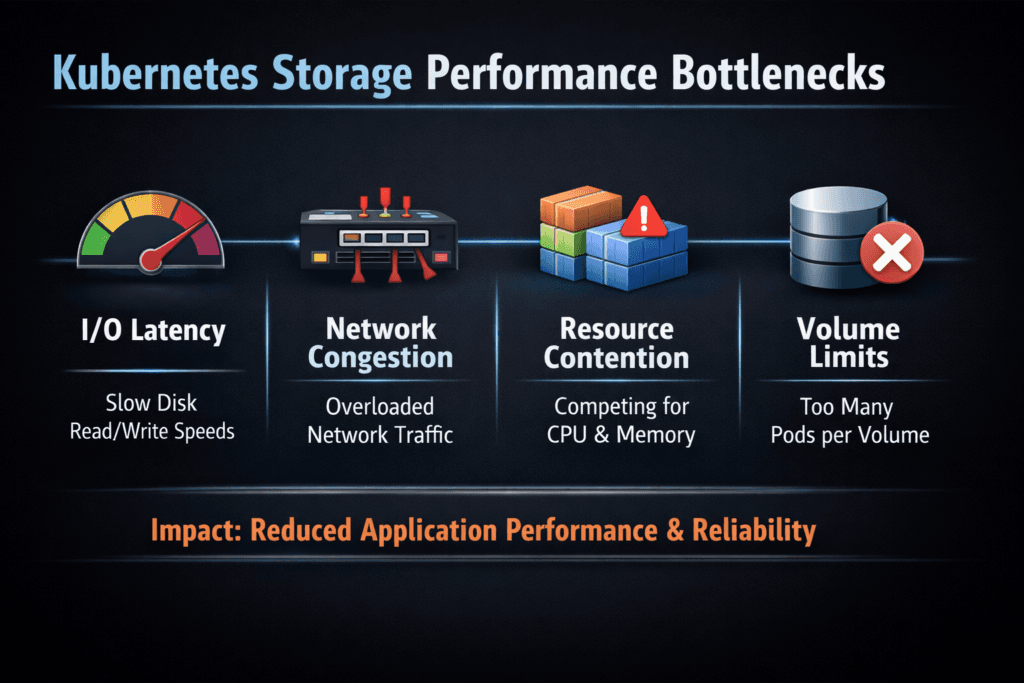
Kubernetes Storage Performance Bottlenecks
Terms related to simplyblock
Kubernetes Storage Performance Bottlenecks happen when your application threads wait on I/O longer than your SLO allows, even though compute looks available. In a typical request path, the pod writes to a filesystem, the kubelet and CSI components translate that into volume operations, the storage network carries traffic (for remote volumes), and the backend commits data to media. Each hop can add latency, amplify tail latency, and cap throughput.
Leaders usually notice the results before they see the cause. Database commits slow down, batch jobs miss their windows, and autoscaling adds nodes without restoring performance. Operators then find a more concrete culprit: contention in shared storage queues, a CPU-heavy data path, small random writes landing on a system tuned for big sequential streams, or a noisy neighbor that consumes the I/O budget.
Kubernetes Storage needs stable p95 and p99 behavior, not just a great peak number. That requirement pushes teams toward NVMe semantics, clean QoS controls, and Software-defined Block Storage that keeps latency consistent under concurrency.
Building predictable storage performance in Kubernetes
Start by treating storage as a performance domain, not as a simple capacity service. Your workload pattern matters more than raw disk speed. A write-heavy OLTP database cares about fsync latency and tail latency under contention, while analytics pipelines care about sustained throughput and parallel reads.
Modern designs reduce overhead by minimizing context switches, cutting extra copies, and using protocols that match NVMe SSD behavior. NVMe supports deep queues and parallelism, which helps when many pods issue I/O at once. Software-defined Block Storage becomes the control plane for that behavior. It enforces tenant boundaries, applies QoS, and keeps the storage pool manageable across upgrades, reschedules, and node churn.
When you plan for predictable outcomes, you define an SLO for latency, IOPS, and bandwidth, then pick an architecture that can enforce it. That approach prevents the most expensive failure mode in Kubernetes: adding compute to compensate for slow storage.
🚀 Reduce Kubernetes Storage Performance Bottlenecks for Stateful Apps
Use Simplyblock to standardize persistent volumes, stabilize throughput, and keep storage SLOs measurable.
👉 Use Simplyblock for Persistent Storage on Kubernetes →
Where Kubernetes Storage Performance Bottlenecks Typically Appear
Most bottlenecks start in one of three places: the node, the network, or the backend.
At the node layer, the hot spots include filesystem settings, excessive journaling overhead for small sync writes, and CPU cost in the I/O path. Storage that relies heavily on kernel processing often increases CPU usage at higher I/O rates, which steals cycles from application pods.
On the network side, latency spikes come from buffer pressure, mis-sized MTU, oversubscribed links, and uneven routing. Even a small jitter can blow up p99 latency for databases. The storage transport also matters. Some protocols impose more overhead per I/O, so they hit a CPU ceiling earlier.
At the backend, contention dominates. Shared pools without strict QoS can let one workload flood queues and punish everyone else. Replication and erasure coding can also change the latency curve when you push concurrency, especially if the system does not isolate tenants or optimize the data path for NVMe.
Kubernetes also introduces operational triggers. Pod reschedules, node drains, and rolling upgrades can shift I/O load quickly. Your storage platform must keep performance steady during those events.
NVMe/TCP as a practical path to NVMe-oF at scale
NVMe/TCP brings NVMe semantics over standard Ethernet, which fits how most Kubernetes fleets already operate. Teams adopt it because it scales across racks and clusters without requiring specialized networking in every environment.
NVMe/TCP can also reduce architectural friction. You can disaggregate storage for capacity growth while keeping high performance, and you can still run hyper-converged tiers where local data paths make sense. That flexibility matters when you run mixed workloads and want one operating model across environments.
For the tightest latency budgets, some teams add NVMe/RDMA tiers for specific workloads. A pragmatic design keeps NVMe/TCP as the default transport for broad compatibility, then assigns RDMA where you need the last mile of latency reduction. Either way, NVMe semantics help you keep queueing behavior predictable, which directly reduces tail latency risk.
In Kubernetes Storage, the key question is not “Which protocol is fastest in a lab?” The real question is “Which transport keeps CPU overhead, latency, and throughput stable under multi-tenant load?”
Proving Kubernetes Storage Performance Bottlenecks with Data
Measure what users feel, not just what dashboards show. Tail latency reveals bottlenecks that averages hide. Focus on p95 and p99 latency for read and write paths, then track IOPS and bandwidth at the same time.
Benchmark with realistic profiles. Use the same block size, queue depth, concurrency, and read/write mix that your production workload uses. Test sync-heavy behavior for databases, and test steady-state throughput for pipelines. Run the benchmark through the same Kubernetes path as production: PVC to CSI to backend. That method captures overhead that bare-metal tests miss.
Also measure CPU cost per I/O. If storage burns the host CPU at higher IOPS, your cluster loses application density, and your cloud bill rises. Tie storage metrics to workload KPIs such as transaction latency, ingestion lag, and checkpoint times. That linkage helps you decide which bottleneck matters most.
Finally, validate scaling. Single-node tests often look clean. Multi-node tests expose lock contention, network oversubscription, and noisy-neighbor effects that matter in real clusters.
Fixing Kubernetes Storage Performance Bottlenecks Without Overprovisioning
You can remove many bottlenecks without buying more hardware by tightening the data path and enforcing boundaries. The most effective improvements follow a simple discipline: change one variable, re-test, and keep the setting only if the data proves the gain.
- Align the storage transport with the workload: use NVMe/TCP broadly, then reserve RDMA tiers for strict latency targets
- Cut data-path overhead: favor user-space, zero-copy designs, and reduce context switches where possible
- Enforce QoS and tenant isolation: protect critical namespaces from noisy neighbors and cap background jobs
- Tune concurrency intentionally: set queue depth and I/O threads based on backend behavior, not defaults
- Choose the right topology per tier: keep hot data close (hyper-converged) when it helps, and disaggregate when you need independent scaling
This approach keeps costs under control because it increases performance per node, not just performance per dollar of new capacity.
Storage Backends Compared by Tail Latency and Efficiency
The table below compares common storage approaches based on what typically drives user-facing pain in Kubernetes: tail latency, CPU efficiency, and how well the system behaves under multi-tenant concurrency.
| Storage approach | Strength | Typical bottleneck trigger | Best-fit use in Kubernetes |
|---|---|---|---|
| Legacy SAN / iSCSI | Familiar operations model | Higher per-I/O overhead, latency variance under load | General workloads with modest latency needs |
| Ceph/RBD-based stacks | Flexible ecosystem, broad adoption | Tail latency spikes under contention without strict QoS tuning | Mixed workloads with careful guardrails |
| NVMe/TCP Software-defined Block Storage | Strong parallelism, better CPU efficiency, stable p99 potential | Requires disciplined network design and clear SLO tiering | Databases, analytics, AI pipelines, and high-concurrency stateful apps |
Storage SLOs at Scale with Simplyblock™
Simplyblock™ targets stable performance for Kubernetes Storage by keeping the data path efficient and the control plane Kubernetes-native. It uses an SPDK-based, user-space, zero-copy architecture to reduce CPU overhead and avoid extra copies in the I/O path. That design helps clusters sustain higher IOPS without burning cores that application pods need.
Multi-tenancy and QoS matter just as much as raw throughput. Simplyblock supports workload-aware policies so teams can enforce storage SLOs per namespace or per class, then protect business-critical services from background noise. That control helps executives because it turns storage into a predictable service, not a variable risk.
Simplyblock also supports flexible deployment models: hyper-converged, disaggregated, or hybrid. Teams use that flexibility to keep hot tiers close to compute while scaling capacity independently, where it makes financial sense.
What’s Next – DPUs, User-Space I/O, and Faster NVMe Fabrics
DPUs and IPUs will push more storage and networking work off host CPUs. That shift improves app density and reduces latency variance because the host no longer competes with storage processing under load.
User-space I/O stacks will also keep growing in Kubernetes environments. They reduce context switches and can improve CPU efficiency at high IOPS. NVMe-oF transports will continue to mature across Ethernet fabrics, which will make NVMe/TCP even more attractive for broad deployment, and RDMA tiers more accessible for latency-sensitive workloads.
Expect more policy-driven storage in Kubernetes. Platforms will translate intent—SLO targets, tenant limits, replication rules—into enforced behavior. That direction aligns well with Software-defined Block Storage that can apply QoS consistently and keep performance stable as clusters scale.
Related Terms
Teams use these terms to pinpoint Kubernetes storage I/O bottlenecks and reduce p99 latency under load.
Questions and Answers
Common bottlenecks include poor I/O scheduling, slow backend storage, high pod density on nodes, and inefficient volume provisioning. Using fast protocols like NVMe over TCP and tuning IOPS limits can significantly improve storage throughput.
In multi-tenant clusters, one workload can overwhelm the storage backend, degrading performance for others. This “noisy neighbor” effect can be mitigated using multi-tenant-aware volumes with enforced IOPS caps and per-volume isolation.
Yes. Choosing network-attached file storage instead of block storage for high-IOPS workloads like databases can severely impact performance. Block storage backed by NVMe infrastructure is better suited for latency-sensitive apps.
While CSI handles control operations, poor driver implementation can delay provisioning or fail to manage node placement correctly, indirectly affecting performance. Optimized drivers, like those used by Simplyblock, minimize overhead and support dynamic volume provisioning with low latency.
Tools like Prometheus, kubelet metrics, and storage-level profilers (e.g., iostat, fio) help identify latency spikes, queue depths, and throughput issues. Combined with CSI metrics, they give full visibility into the end-to-end I/O path.