Ceph Performance Bottlenecks
Terms related to simplyblock
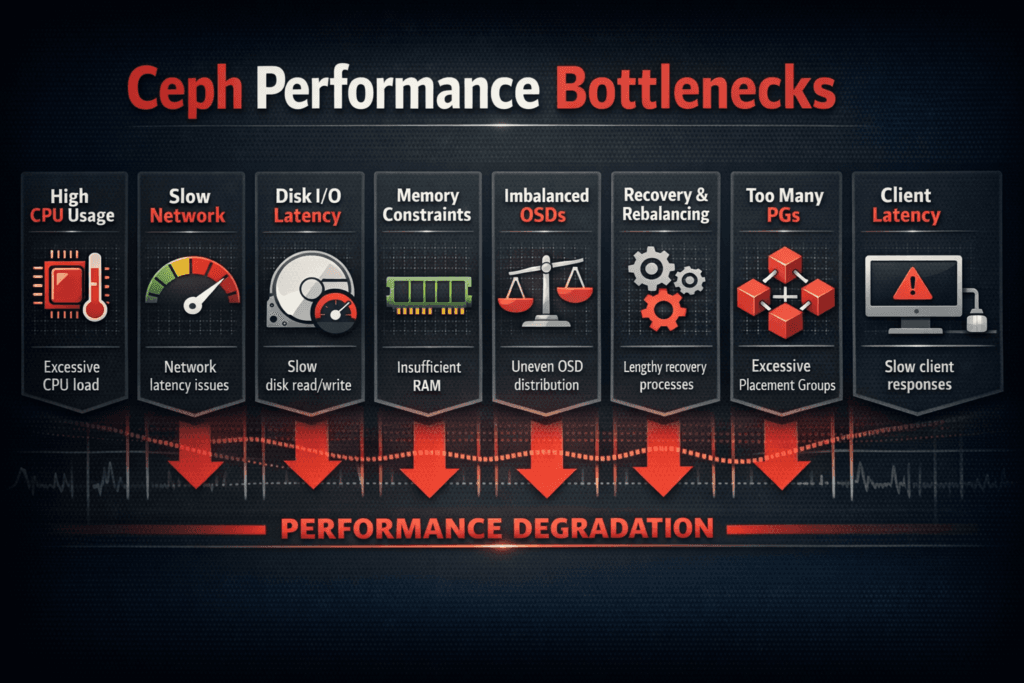
Ceph performance bottlenecks happen when the cluster stops scaling IOPS, throughput, or p99 latency steadily. Teams often see the problem first in the slow tail. Average latency can look fine, while p99 climbs and breaks SLOs. Costs then rise because teams add nodes just to hold response times.
Ceph usually hits limits for repeatable reasons. OSD CPU becomes a wall during small writes with replication and checksums. BlueStore adds DB and WAL work that can slow mixed read/write traffic. Networks also cap performance when client traffic and cluster traffic share the same links. Kubernetes churn adds frequent change, and that change can make hotspots show up faster.
Building Faster Data Paths With Modern Storage Design
Modern storage designs improve scaling by cutting work per I/O. A short hot path reduces CPU burn and lowers queue depth. That approach helps most on NVMe-heavy nodes where CPU, not media, sets the ceiling.
Background tasks also need strict guardrails. Recovery, backfill, and scrub can steal bandwidth and CPU from application I/O. When a cluster lacks headroom, p99 rises during normal operations, not only during failures. A good design separates foreground I/O from background work and enforces limits that protect the tail.
🚀 Compare Ceph vs NVMe/TCP on the Same Hardware
Use Simplyblock to measure IOPS per core and tail latency side by side.
👉 Read Simplyblock vs Ceph →
Ceph Performance Bottlenecks in Kubernetes Storage
Kubernetes changes Ceph load patterns all day. Pods move after drains. Autoscaling adds bursts. Several teams share the same pools and links. Those shifts can push traffic onto a small set of OSDs even when the hardware looks underused.
Placement adds another risk. A pod can land on a node with poor network locality to storage. Multiple hot pods can also land on one node and compete for CPU, memory bandwidth, and NIC queues. Operators should watch client-side CPU and queueing, not only OSD charts, because client pressure often explains p99 spikes.
Ceph Performance Bottlenecks and NVMe/TCP
NVMe/TCP provides high-performance block access over standard Ethernet, which makes it a common comparison point. Ceph does not run its internal replication over NVMe/TCP like an NVMe-oF target does. Even so, teams still compare the outcomes because they care about p99 and CPU per I/O on dense nodes.
Many Ceph bottlenecks trace back to CPU overhead and queue buildup. A user-space NVMe/TCP target based on SPDK can reduce kernel work and avoid extra copies on the hot path. That change often improves IOPS per core and stabilizes p99 at high concurrency. In a fair comparison, teams should test the same workload, the same network, and the same failure events.
Measuring and Benchmarking Ceph Performance Bottlenecks Performance
Start with tests that match production. Use the same block sizes, read/write mix, and sync settings. Increase load in steps, such as one client, three clients, and six clients. Track p50, p95, and p99 along with throughput and CPU per IOPS. When throughput flattens and p99 rises, queues usually cause the problem.
Test degraded mode on purpose. Trigger recovery or rebalance during a controlled window. Measure how much p99 and throughput drop during that event. Many teams meet targets in normal mode and miss them in degraded mode, so the degraded gap often defines the real limit.
Targeted Fixes That Reduce Bottlenecks
Use these actions to reduce common Ceph bottlenecks without guesswork.
- Split client traffic from cluster traffic, and size links for rebuild load.
- Place BlueStore DB/WAL on faster media when the write path needs it.
- Tune scrub and recovery to protect p99 during business hours.
- Balance PGs and device classes to reduce hot OSDs and uneven pools.
- Alert on p99 drift during backfill and recovery, not only on averages.
Performance Trade-offs Across Storage Options
The table below summarizes common bottleneck patterns in Ceph, then contrasts them with a lean NVMe/TCP block design. Use it to plan a side-by-side test on the same hardware.
| Option | First limit in many setups | What teams often see | Best fit |
|---|---|---|---|
| Ceph on mixed media | OSD CPU, DB/WAL pressure | p99 rises during scrub and backfill | Broad needs with strong durability |
| Ceph on NVMe | CPU per I/O, metadata writes | High core use at peak IOPS | NVMe-heavy clusters with tuning discipline |
| NVMe/TCP block targets | Network or media before CPU | Better IOPS per core, tighter p99 | High-performance block over Ethernet |
| SPDK-based targets | Network or device queues | High throughput with low CPU cost | Low-latency apps on dense nodes |
Scaling Predictably With Simplyblock™ Beyond Ceph Limits
Simplyblock™ targets the pain points that drive many Ceph comparisons: tail latency, CPU overhead, and day-2 friction. Simplyblock uses an SPDK-based, user-space, zero-copy style data path to keep CPU cost per I/O low. It also supports NVMe/TCP and NVMe/RoCEv2, so teams can match transport to operational needs.
Kubernetes Storage teams can deploy simplyblock in hyper-converged, disaggregated, or mixed layouts. Multi-tenancy and QoS help limit noisy-neighbor impact in shared clusters. Teams can also migrate in stages and validate p99 at each step, which keeps risk under control.
What Changes Next for Ceph and High-Scale Block Storage
Teams now design around p99 because the slow tail drives user timeouts and database stalls. Better visibility into queues and rebuild impact will matter more as clusters grow.
Many platforms will also move protocol work off host CPUs through DPUs and similar offload paths, especially on dense baremetal nodes. Storage stacks that keep the hot path simple will adapt faster as NVMe-oF options expand.
Related Terms
Teams use these related glossary pages to pinpoint Ceph bottlenecks faster.
What is Ceph
Kubernetes Storage Performance Bottlenecks
Storage Rebalancing
NVMe over TCP (NVMe/TCP)
Questions and Answers
In many clusters, the first ceiling is CPU-per-IOPS on the Ceph data path, not NVMe latency. You’ll see IOPS flatten while host CPU climbs and p99 worsens, especially under mixed reads/writes. Track this alongside tail latency using storage metrics in Kubernetes and relate it to your workload’s storage latency vs throughput.
Recovery and backfill compete with client I/O for disk queues and east–west bandwidth, so the cluster looks healthy, but p99 spikes and apps stall. The risk increases after expansion or node churn because data movement becomes continuous. Treat movement as a latency budget problem and model it like storage rebalancing impact rather than a background detail.
Ceph can become network-bound when replication/EC fan-out, recovery traffic, and client I/O share the same fabric. Symptoms are rising p99 with stable disk utilization, plus throughput that doesn’t improve after adding OSDs. Validate with counters that point to storage network bottlenecks in distributed storage before chasing disk tuning.
In Kubernetes, reschedules and rolling upgrades can change the I/O path while traffic stays constant, exposing tail-latency cliffs. Add CSI sidecars and control-plane operations, and you can bottleneck on “plumbing” rather than disks. Use CSI performance overhead plus the end-to-end view in Kubernetes storage performance bottlenecks to spot where latency is really added.
Databases feel tail latency, so a small p99 increase in the Ceph path can blow up commit times, lock hold times, and connection backlogs. This often looks like “random” slow queries, not a storage alert. Validate the linkage with storage latency impact on databases and database performance vs storage latency.