Ceph Data Path
Terms related to simplyblock
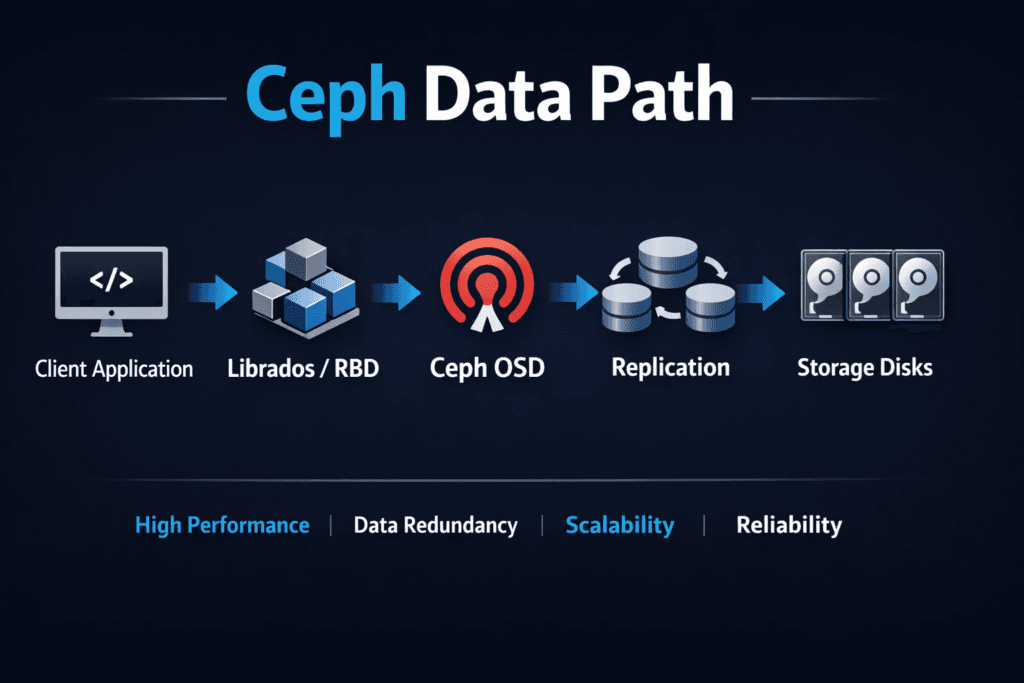
The Ceph Data Path is the route a read or write takes from an application to storage and back. That route can include the client stack, the network hop into the cluster, the OSD work that stores data, and the durability work that protects it during failures. More steps can bring more resiliency, but they can also add latency swing under mixed load.
Leaders usually care about one outcome: stable performance as the cluster grows. Operators care about the knobs that keep p95 and p99 latency steady during rebuilds, noisy neighbors, and daily Kubernetes churn. This is where Kubernetes Storage and Software-defined Block Storage designs start to diverge in real-world results.
Ceph Data Path – What Happens on a Read or Write
A Ceph read or write touches several layers that each add work. The client issues I/O, the cluster decides where data belongs, and OSDs commit data while they also track placement and health. Those steps help Ceph scale out, yet they also create more places for queueing and contention.
Workload shape matters as much as raw media speed. Small random I/O stresses CPU, queues, and internal metadata. Large sequential flows stress the network and bandwidth. When one cluster serves both patterns at once, tail latency often rises, especially during recovery.
SPDK enters the comparison because it starts with a different goal. It cuts layers in the hot path by running I/O in user space and reducing context switching. That design often improves CPU efficiency and steadies latency under load.
🚀 Shorten the Ceph Data Path for Lower p99 Latency in Kubernetes
Use Simplyblock to run NVMe/TCP Software-defined Block Storage with QoS and steadier tail latency.
👉 Improve the Storage Data Path in Kubernetes →
Ceph Data Path Under Kubernetes Storage Pressure
Kubernetes Storage adds two hard realities: change and contention. Pods reschedule, nodes drain, and autoscalers create bursts at awkward times. Meanwhile, many namespaces share the same backend. Each of those events can increase queue depth and widen latency spread.
Ceph can support Kubernetes well when teams invest in pool layout, network separation, and recovery limits. Even then, the platform must balance two jobs at once. It must serve app I/O while it also heals the cluster and rebalances data.
SPDK-based Software-defined Block Storage often targets this exact problem. It focuses on performance isolation and lower overhead per I/O. That approach can reduce noisy-neighbor impact and improve “IOPS per core,” which helps cluster density.
Ceph Data Path and NVMe/TCP at Scale
NVMe/TCP brings NVMe-oF semantics to standard Ethernet, which makes adoption easier in many data centers. It also shifts the spotlight to software overhead. When the storage path burns too many CPU cycles per I/O, latency climbs fast as concurrency grows.
Ceph benefits from fast networks and NVMe media, but it still runs a layered distributed path end to end. SPDK-style targets often pair neatly with NVMe/TCP because both aim to lower overhead in the hot loop. That pairing can help teams hit tighter p99 goals for databases, analytics, and AI ingest.
If you want a SAN alternative with cloud-native ops, measure how each option behaves during peak contention, not just in a clean lab run.
How to Benchmark the Real I/O Path
Benchmarking should match production patterns and time windows. Short tests can hide queue buildup, background work, and cache effects. Repeatable runs tell the truth.
- Measure p50, p95, and p99 latency for reads and writes at the block sizes your apps use.
- Track CPU cost per IOPS on both client and storage nodes.
- Run mixed tests (for example, 70/30 read/write) to surface tail behavior.
- Test during recovery and node loss to see how rebuild affects foreground I/O.
Also, watch fairness. A platform that looks fast in isolation can still fail when tenants compete.
Practical Ways to Reduce Latency Swing
Ceph tuning usually starts with controlling background work. Tight recovery limits can protect foreground I/O, but they can also slow time-to-heal. Pool design also matters. Separate workloads with different I/O shapes so they do not fight for the same resources.
SPDK-oriented tuning targets a smaller set of levers. Teams pin cores, size hugepages, and manage queue depth with discipline. They also keep the I/O path in user space to avoid extra copies. This strategy often produces a tighter latency band, especially when Kubernetes loads fluctuate.
In both cases, you get the best results when you treat storage as a service with clear SLOs, not as a shared “best effort” pool.
Decision Table for Platform Owners
Before you pick a direction, align on what you need to optimize: feature breadth, ops effort, or predictable tail latency. The table below summarizes common tradeoffs.
| Area | Ceph (distributed stack) | SPDK-based Software-defined Block Storage (example: simplyblock) |
|---|---|---|
| Main strength | Broad storage services and proven scale-out | Low-overhead data path and tighter latency control |
| Where risk shows up | Tail latency during contention and recovery | Requires strong CPU and core planning |
| Kubernetes fit | Strong when teams already run Ceph well | Strong when teams need strict fairness and QoS |
| NVMe/TCP impact | Gains from faster media, but overhead can rise | Often strong IOPS-per-core with NVMe/TCP |
| Best use case | Shared platform with many storage needs | Performance-first stateful apps at scale |
Performance Consistency with Simplyblock™
Simplyblock™ focuses on a performance-first path using SPDK concepts, user-space I/O, and a zero-copy approach. That design aims to reduce CPU waste and keep latency steadier under pressure. It also supports NVMe/TCP and fits Kubernetes Storage deployments that run hyper-converged, disaggregated, or mixed layouts.
Simplyblock™ also targets day-two realities. Multi-tenancy and QoS help teams keep one workload from taking over the cluster. Those controls matter when you deliver Software-defined Block Storage as a shared platform for many teams.
What to Watch Over the Next 12–24 Months
Storage stacks will keep moving toward lower overhead per I/O and better isolation per tenant. DPUs and IPUs will push more data-path work closer to the network edge. Kubernetes will keep raising expectations around automation, fast rollout, and stable behavior during churn.
Ceph will keep improving as a broad platform. SPDK-based designs will keep pushing for tighter p99 and better CPU efficiency. Your best choice depends on the SLOs you must meet and the ops model you can support.
Related Terms
Teams use these pages when they review Ceph Data Path tradeoffs.
Ceph Replacement Architecture
RADOS Block Device (RBD)
Storage Data Plane
Kubernetes Storage Performance Bottlenecks
Questions and Answers
In the Ceph data path, CPU burn often comes from per-IO messaging, replication/EC work, and queue contention long before NVMe media is saturated. That’s why p99 can worsen even when disks look “idle.” Compare behavior using Control Plane vs Data Plane in Storage and the broader Storage Data Plane view.
RBD breaks a block volume into objects stored in RADOS pools, so a single host’s I/O becomes distributed operations across OSDs. Under high concurrency, this can amplify network fan-out and queuing, which shows up as tail-latency jitter. This is the core mechanic behind RADOS Block Device (RBD) and how Ceph serves block.
Recovery/backfill injects large internal I/O that competes for the same disk queues and east–west bandwidth as application reads/writes. Apps often feel this as p99 spikes and slower fsync/commit times, not a clean throughput drop. Treat it as an SLO issue using Storage Rebalancing Impact and test during churn, not only steady-state.
Ceph can become network-bound when replication/EC and recovery traffic share the same fabric as client I/O. Symptoms are rising tail latency and flat scaling after adding OSDs, even with fast drives. Validate the constraint with Storage Network Bottlenecks in Distributed Storage before tuning disks.
Even if the steady I/O path is fine, CSI operations (publish/stage, reschedules, rollouts) can bottleneck on control-plane backpressure and node CPU, delaying readiness and amplifying perceived storage latency. To debug, separate CSI control signals from hot-path I/O using CSI Control Plane vs Data Plane and CSI Performance Overhead.