NVMe-oF Data Path
Terms related to simplyblock
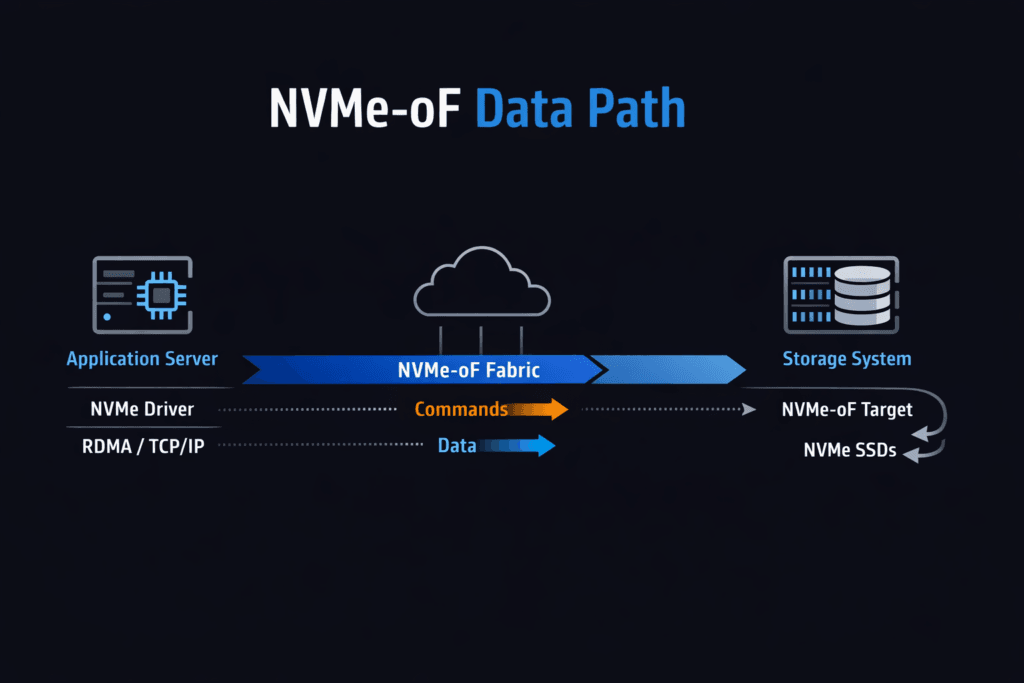
An NVMe-oF Data Path is the end-to-end route that NVMe commands and data take between an application host and remote NVMe storage across a fabric. The path begins at the app I/O request, moves through the host NVMe-oF initiator, crosses the network transport, reaches the NVMe-oF target, and completes at the NVMe media. Every hop adds latency, uses CPU, and can widen p99 timing when the system shares resources with noisy workloads.
Leaders track this topic because the data path often decides workload density and cloud spend. Platform teams track it because “average latency” hides the real risk. Tail latency drives retries, queue buildup, and cascading slowdowns for databases and stateful services. A strong data path keeps work per I/O low, keeps queueing short, and keeps behavior steady during change events.
This also fits the shift toward Software-defined Block Storage, where storage becomes an API-backed platform service. In that model, NVMe-oF helps disaggregate compute and storage while preserving NVMe semantics. Many enterprises standardize on NVMe/TCP because it runs on Ethernet and scales across common networks.
Shaping a Low-Overhead Storage Fast Path
Most tuning wins come from removing avoidable work. Extra memory copies waste CPU cycles. Frequent context switches add jitter. Interrupt-heavy designs can also spike latency when concurrency rises.
User-space approaches, often built on SPDK, reduce this overhead by keeping the hot loop tight and by using polling where it fits. That design can improve IOPS per core and tighten latency spread, especially on baremetal. Even with a user-space path, you still need good CPU placement, stable NUMA alignment, and a sane network queue layout. Those basics keep the stack from fighting itself.
A practical rule helps: treat CPU, memory locality, and network queues as storage resources. When you budget them the same way you budget capacity, the path stays stable as load grows.
🚀 Reduce Data-Path Overhead with IO Path Optimization
Use Simplyblock to standardize a low-overhead storage path for Kubernetes Storage.
👉 Improve Storage IO Path Efficiency →
NVMe-oF Data Path in Kubernetes Storage
Kubernetes Storage adds constant motion. Pods restart. Nodes drain. Clusters scale. Each event can move I/O to a new host, a new NUMA layout, or a different network route.
A reliable design reserves CPU for storage services and keeps that CPU away from bursty pods. It also aligns NIC queues, storage threads, and NVMe devices on the same NUMA node when possible. That alignment reduces cross-socket traffic and cuts latency variance. Teams should also test the full lifecycle: volume create, attach, reschedule, failover, rebuild, and rolling upgrades. These steps expose weak links that steady-state tests miss.
When the platform holds latency steady through that churn, teams can run hyper-converged, disaggregated, or hybrid topologies without changing how apps consume volumes.
NVMe-oF Data Path and NVMe/TCP
NVMe/TCP carries NVMe-oF traffic over standard TCP/IP networks. Teams like it because it works on common Ethernet gear and fits existing ops playbooks. CPU cost and jitter become the main trade-offs, since the TCP stack consumes cycles and reacts to congestion.
You can tighten results with a disciplined queue and CPU design. RSS should spread flows evenly across NIC queues. MTU settings must stay consistent end-to-end. NUMA placement must keep packet handling close to the right cores and memory. With those controls, NVMe/TCP can deliver strong throughput and sub-millisecond behavior for many enterprise workloads, even at scale.
Some orgs add an RDMA tier for the smallest latency budgets. That approach works best when the platform keeps operations uniform across transports.
Benchmarking NVMe-oF Data Path Performance
Benchmarks should answer production questions, not lab questions. Start with the workload shape: block size, read/write mix, sync behavior, and concurrency. Run tests long enough to capture drift and tail behavior. Short runs often hide queue buildup and background work effects.
Track three anchors that make results actionable. Start by checking p99 latency at a fixed throughput target. Next, validate throughput at a fixed p99 limit. Finally, compare CPU cost across both runs. These anchors show whether CPU, network, or media sets the ceiling.
Then test stress events. Drain a node. Force a rebuild. Rotate pods. If p99 latency jumps hard during these events, the path lacks isolation or fair sharing. Fix those gaps before you scale the fleet.
Tuning Moves That Consistently Help
Make one change at a time and re-run the same workload. Use this checklist as a starting point:
- Pin CPU cores for the storage plane and keep those cores isolated from bursty workloads.
- Align NUMA placement for NIC queues, hugepages, storage threads, and NVMe devices.
- Tune queue depth and thread counts to match device parallelism without building long queues.
- Keep MTU consistent and validate RSS distribution to avoid queue hot spots.
- Enforce QoS limits so one tenant cannot crowd out others and inflate tail latency.
Operational Trade-Offs Across Common Designs
The table below summarizes common deployment styles and the trade-offs teams see in daily operations.
| Design Style | Typical Transport | Ops Effort | Common Outcome |
|---|---|---|---|
| Ethernet standardization | Familiar tooling, higher cost, and fabric complexity | Low | Fast rollout, depends on CPU and queue hygiene |
| Performance tiering | NVMe/TCP + RDMA | Medium | Lower latency for select workloads, more tuning work |
| Legacy SAN transition | NVMe/FC + Ethernet | Medium to high | Familiar tooling, higher cost and fabric complexity |
Running the Data Plane with simplyblock™
Simplyblock™ focuses on Software-defined Block Storage built for Kubernetes Storage, with an NVMe-first design and strong NVMe/TCP support. The platform targets steady p99 behavior by protecting the storage plane, enforcing multi-tenant QoS, and keeping background work from stealing the fast path.
This matters in mixed fleets. A platform approach reduces “hero tuning” and makes behavior repeatable across clusters. It also supports flexible topologies, so teams can start hyper-converged and later disaggregate storage without changing application storage semantics. That flexibility helps leadership align cost with growth while keeping the operator experience consistent.
What’s Next for Fabric-Based NVMe Performance
Teams will push for better CPU efficiency, clearer telemetry, and more automation. Better visibility will help teams tie p99 spikes to a real cause, such as a hot NIC queue, a noisy neighbor, or a rebuild wave. DPUs and IPUs will also play a bigger role as enterprises look for offload options that free the host CPU for applications.
Over time, the best stacks will treat the data path as a managed product: measurable, stable under churn, and resistant to config drift.
Related Terms
Useful follow-ons when you tune NVMe/TCP behavior and reduce overhead in Kubernetes Storage.
Questions and Answers
The NVMe-oF data path starts at the host initiator, traverses the chosen fabric transport, reaches the target, and then maps to a namespace backed by NVMe media. Latency is usually dominated by queueing at the host CPU/NIC or fabric, not raw SSD time, once concurrency rises. Anchor your mental model with What is NVMe-oF and validate transport-specific behavior using the NVMe over TCP architecture.
p99 spikes typically come from host-side CPU saturation, NIC queue imbalance, or fabric contention that adds queueing delay before the target even touches the drive. This is why “fast NVMe” doesn’t guarantee stable latency over the network. If throughput flattens while media utilization stays moderate, suspect the fabric. Use Storage network bottlenecks in distributed storage to frame the diagnosis.
With multipathing, the steady-state path can be clean, but failover introduces transient latency from reconnect, path selection, and cache/queue warmup effects. The real metric is how quickly p99 returns to baseline after a link or target loss, not just whether I/O continues. Design and validate HA around NVMe multipathing rather than assuming SAN-like behavior “for free.”
SPDK can keep the hot path in the user space and use polling to reduce context switches and scheduler jitter, often improving CPU efficiency and stabilizing tail latency. The tradeoff is dedicating cores and enforcing NUMA locality; p99 can get worse, not better. This is the core design rationale behind SPDK for NVMe over Fabrics.
Benchmark the full pipeline: initiator CPU, fabric behavior, target CPU, and media, using workload-shaped tests that match your block sizes and concurrency. Compare p95/p99 and CPU-per-IOPS, then repeat under degraded conditions like link loss or background traffic, because that’s where NVMe-oF designs diverge. Use consistent methodology from storage performance benchmarking so results aren’t “hero numbers.”