CSI Controller vs Node Plugin
Terms related to simplyblock
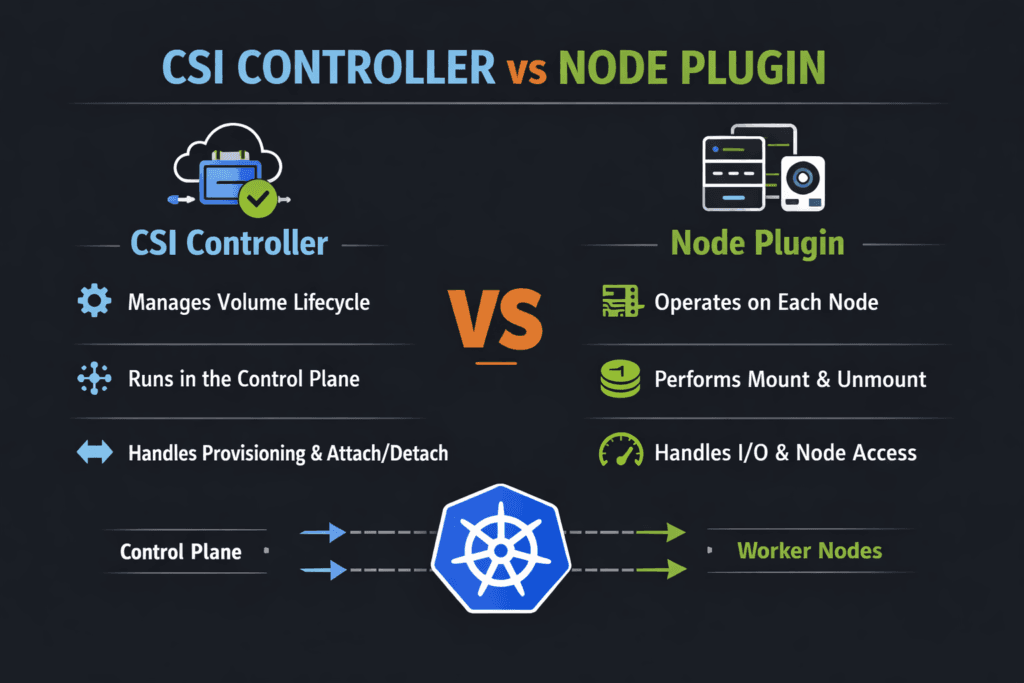
CSI drivers split storage work into two parts. The controller side manages cluster-wide lifecycle actions. The node side runs on each worker and performs host tasks like stage, mount, unmount, and cleanup.
This split changes how problems show up. Controller delays slow PVC binding and snapshot work. Node delays block pod startup and stretch drains. Teams fix issues faster when they map each symptom to the right component in Kubernetes Storage.
Modern Tuning Patterns for CSI Driver Components
Treat lifecycle speed and runtime I/O as separate targets. Lifecycle speed covers create, delete, clone, snapshot, and expand. Runtime I/O covers reads and writes after the mount completes.
Keep the control plane simple. Limit retries and avoid long blocking calls. Size controller replicas for peak churn during deploys. On nodes, protect the kubelet and the node plugin with steady CPU and memory headroom. Stable nodes reduce mount delays and reduce restart risk.
For Software-defined Block Storage, focus on variance, not only peak numbers. A steady p99 latency profile helps more than a short-lived throughput spike.
🚀 Speed Up PVC Provisioning and Pod Starts
Use Simplyblock to keep CSI controller workflows fast and node mounts consistent at scale.
👉 Use Simplyblock for Kubernetes Storage →
CSI Controller vs Node Plugin Inside Kubernetes Storage Workflows
The controller plugin usually runs as a Deployment. It watches objects like StorageClass, PVC, snapshots, and expansion requests. It then calls the backend and writes the status back to Kubernetes.
The node plugin usually runs as a DaemonSet. It connects the node to the volume, stages it, and publishes it into the pod. That path gates pod readiness. Node pressure, device scan delays, and slow attach logic often show up here.
Use this rule of thumb. If PVC binding lags, start with controller signals. If pods stall while mounting, start with node signals.
CSI Controller vs Node Plugin and NVMe/TCP Data Paths
NVMe/TCP carries NVMe commands over Ethernet. It fits many data centers because it uses standard networks. It also targets low overhead on the data path.
Controller actions rarely depend on microsecond latency. They depend on fast, clean lifecycle calls. Node behavior depends on connection speed, queue settings, and CPU cost per I/O. Keep queues deep enough for throughput, but not so deep that tail latency spikes.
User-space NVMe stacks can cut CPU use per I/O. That helps busy nodes keep p95 and p99 latency tighter under load.
Practical Ways to Measure CSI and Mount Readiness
Use two scorecards.
Lifecycle timing tells you how fast storage becomes usable. Track PVC create to Bound, pod schedule to volume mounted, drain time for stateful pods, and snapshot restore time.
Runtime I/O tells you how stable the performance is. Run tests inside pods with real block sizes and queue depth. Report IOPS, throughput, p95, and p99 latency. Include node CPU in every run. High CPU often drives jitter that looks like a storage fault.
Tactics That Reduce CSI and Node-Side Latency
Use one repeatable plan, and tie each change to a metric you already track.
- Measure
PVC-to-Bound,Pod-to-Ready, and p99 latency in the same window, so you separate lifecycle delays from I/O issues. - Reserve CPU headroom for kubelet and the node plugin on storage-heavy workers, then validate mount time during rolling updates.
- Tune NVMe/TCP queue depth so burst traffic does not create long queues and latency spikes.
- Use topology-aware placement, so storage traffic avoids extra hops, especially in mixed hyper-converged and disaggregated setups.
- Enforce QoS and multi-tenancy so one namespace cannot starve another in shared Software-defined Block Storage pools.
Side-by-Side View of CSI Responsibilities and Failure Modes
This table helps teams pick the right starting point when stateful apps slow down.
| Dimension | Controller plugin focus | Node plugin focus |
|---|---|---|
| Primary job | Lifecycle orchestration | Host stage and publish |
| Common symptoms | Add node headroom, stabilize paths, and improve discovery | Pods stuck mounting, slow restart |
| Best signals | Events, sidecar logs, API latency | kubelet timing, node pressure, mount timing |
| Typical fixes | Reduce retries, scale controller, speed backend metadata | Add node headroom, stabilize paths, improve discovery |
| Business impact | Slower releases, slower recovery | Slower startup, longer failover |
Predictable CSI Outcomes with Simplyblock™
Simplyblock™ supports Kubernetes Storage with Software-defined Block Storage that targets stable behavior under churn and load. It keeps lifecycle flows clean through CSI, and it aims for an efficient runtime path.
For Ethernet NVMe designs, simplyblock supports NVMe/TCP and uses an SPDK-based, user-space design to reduce overhead on the hot path. That can lower CPU cost per I/O and help keep tail latency steady when clusters run many tenants and many stateful services.
What to Expect Next in CSI Driver Design
CSI keeps moving toward clearer readiness signals and better automation around mount flows. More drivers also use stronger topology hints, so pods land closer to the storage path that serves them best.
Hardware offload will also grow. DPUs and IPUs can take more storage work off host CPUs, which reduces jitter on busy nodes. As NVMe-oF spreads, NVMe/TCP should remain a common choice in Ethernet-first environments.
Related Terms
Teams often review these glossary pages alongside the CSI Controller vs Node Plugin.
- CSI NodePublishVolume Lifecycle
- CSI Topology Awareness
- CSI Resize Controller
- CSI Control Plane vs Data Plane
Questions and Answers
The CSI Controller Plugin handles cluster-wide lifecycle RPCs like Create/DeleteVolume, ControllerPublish/Unpublish (attach), snapshot/clone, and resize coordination. The Node side focuses on per-host actions like staging, mounting, and device setup. Knowing the split helps debug “PVC stuck provisioning” vs “pod stuck mounting” by looking at the right component logs.
The CSI Node Plugin must run on every worker node to perform local mount/unmount, formatting, and path management for pods scheduled there. The Controller plugin doesn’t need to be on every node because it performs centralized control-plane operations and talks to the Kubernetes API. This difference explains why node-level failures break mounts on one node, not the whole cluster.
CreateVolume failures are typically controller-side issues: backend credentials, quotas, topology, or snapshot/clone constraints. Mount failures usually happen on the node during the publish path, where the kubelet requests the node plugin to stage and mount the volume into the pod. The CSI NodePublishVolume lifecycle is the key place to check when pods are Pending/ContainerCreating with mount errors.
Attach is a control-plane decision that makes a volume available to a node (or validates access), while mount is a node-local operation that turns the volume into a filesystem path or raw block device inside the pod. You can see cases where attach succeeds but mount fails due to filesystem errors, missing kernel modules, or node permissions. Splitting these steps keeps provisioning scalable and makes failures easier to localize.
If provisioning, attaching, resizing, or snapshots are failing across the cluster, check controller sidecars first because they drive many control-plane flows via Kubernetes resources and CSI RPCs. If only certain nodes fail to mount, focus on the node plugin and kubelet interactions. A fast heuristic is: PVC lifecycle errors usually correlate with controller components; pod mount errors usually correlate with node components.