Kubernetes Storage Latency Sources
Terms related to simplyblock
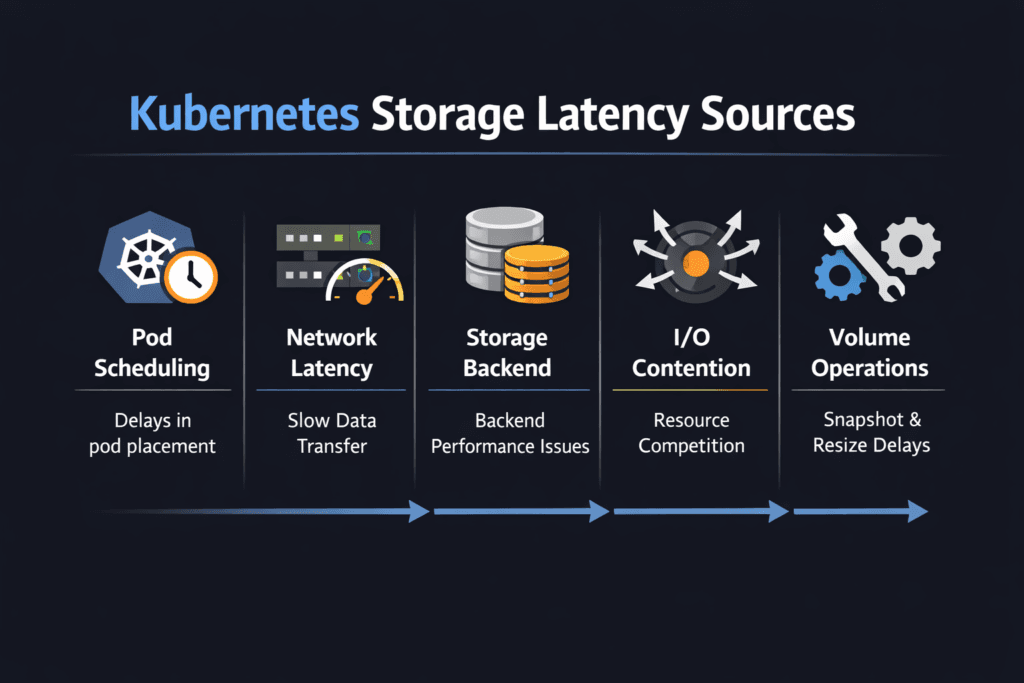
Kubernetes Storage Latency Sources are the points in the I/O journey where delay gets added before an application sees a read or write complete. In Kubernetes, latency rarely comes from a single cause. It builds across the pod, node, CSI layer, network path, and the storage backend.
Once teams can name the sources, they can fix the right layer fast. That’s how p95 and p99 stay under control during bursts, reschedules, and upgrades.
Optimizing Kubernetes Storage Latency Sources with Practical Controls
Lower latency starts with a shorter, calmer path. The biggest wins usually come from reducing contention and keeping the I/O pipeline steady under load. Instead of “tuning everything,” focus on the few controls that influence tail latency the most: queue growth, CPU headroom on nodes, and fair sharing when many workloads hit the same backend.
Healthy ops habits matter too. A cluster that changes every day needs storage behavior that stays consistent through change, not only during a quiet benchmark run.
🚀 Identify and Reduce Kubernetes Storage Latency Sources
Use Simplyblock to pinpoint where latency is added across the node, network, and storage path—then remove the biggest bottlenecks.
👉 Use Simplyblock to Fix Kubernetes Storage Latency →
Mapping delay across the Kubernetes I/O path
Every read or write moves through multiple layers: application → filesystem → kernel block layer → CSI plumbing → storage backend. If the request crosses the network, transport behavior becomes part of the latency budget as well.
Latency spikes usually follow recognizable patterns. Queue buildup stretches response times. CPU pressure slows completion. Retries add sudden stalls. Backend saturation creates noisy-neighbor effects. When you map these patterns to metrics, troubleshooting becomes repeatable.
NVMe/TCP effects on end-to-end storage latency
NVMe/TCP can keep I/O behavior efficient while running on standard Ethernet, which makes it attractive for scale-out designs. Still, the network and the host CPU influence results. A hot node or a congested link can inflate tail latency even when flash has headroom.
The goal is balance: avoid single-path hotspots, keep queue depth aligned with the workload, and reserve enough CPU for the data path. With that baseline, NVMe/TCP stays stable for stateful workloads.
Measuring and Benchmarking Kubernetes Storage Latency Sources Performance
Benchmarking should answer two questions: “How high is latency?” and “Where is it coming from?” Start with a baseline under low contention, then run the same workload under stress so comparisons stay valid.
Track app-visible p95/p99, node CPU pressure, queue growth, network retransmits, and backend saturation signals together. When tail latency rises while queues climb, contention is likely. If tail latency rises with CPU spikes, node overhead is a suspect. If tail latency rises with retransmits, the network path is contributing.
Approaches for Improving Kubernetes Storage Latency Sources Performance
- Cap burst damage by preventing runaway queue growth during spikes.
- Reserve CPU headroom for storage work so completions don’t wait behind other node tasks.
- Reduce shared contention by enforcing clear limits and fair sharing across workloads.
- Balance network paths and remove single-link bottlenecks that trigger retries.
- Re-test under churn (reschedules, rolling upgrades, background jobs) to catch regressions early.
Latency-source mitigation matrix
Quick view of root causes, fixes, and trade-offs by latency contributor.
| Latency source | What it looks like | What usually helps | What to validate |
|---|---|---|---|
| Node CPU pressure | p99 spikes during busy periods | reserve CPU, reduce interrupt hotspots | softirq time, run queue, CPU steal |
| Queue buildup | slow p95 rise, sharp p99 jump | tune concurrency, add fairness controls | queue depth, backlog growth |
| Network jitter | uneven latency, retries | reduce drops, balance traffic | retransmits, drops, microbursts |
| Backend contention | noisy-neighbor symptoms | isolation + QoS boundaries | per-volume limits, saturation signals |
| Operational churn | latency swings during upgrades | steady policies + tested procedures | attach/mount timing, event delays |
Keeping performance steady with Simplyblock
Simplyblock focuses on keeping the I/O path tight for Kubernetes storage, so latency doesn’t wander during normal cluster changes. The most important outcome is control: fewer hidden bottlenecks, clearer boundaries between workloads, and a data path that stays stable when the cluster is under pressure.
When you standardize storage tiers, enforce fair sharing, and keep the data path efficient, latency troubleshooting becomes easier, and tail latency stops surprising teams.
Future Directions and Advancements in Kubernetes Storage Latency Sources
Latency control is shifting toward automation that reacts to early warning signals. Platforms are getting better at detecting queue growth, spotting network-induced jitter, and identifying CPU pressure before users feel it. Observability is improving too, so teams can trace delay across pod → node → network → backend without stitching five dashboards together.
Over time, expect tighter alignment between scheduling intent and storage behavior, so performance targets hold as clusters scale.
Related Terms
Teams review these pages when setting targets for Kubernetes Storage Latency Sources.
Questions and Answers
Kubernetes storage latency is usually a sum of queueing at the application, filesystem, and kernel block layers, plus CSI handoffs, plus backend device/transport time. The “hidden” part is contention: CPU pressure, IRQ/softirq load, and cgroup throttling can delay completions even when the storage is fast. Treat end-to-end storage latency as a pipeline, then isolate each segment with targeted measurements.
CSI itself isn’t on the data path for every I/O, but it can introduce latency indirectly through mount options, device discovery, multipath behavior, and recovery/teardown retries. The largest spikes tend to come during lifecycle transitions (node restart, pod reschedules) when mounts are reconciled, and stale paths are cleaned up. Measure steady-state latency separately from “ops churn” latency so you don’t tune the wrong problem.
p99 spikes usually mean transient queue buildup, not slower media. Common causes are background rebuild/GC, bursty neighbors, TCP retransmits, CPU starvation, or filesystem journaling pressure. Average latency hides this because most I/Os still complete quickly, while a small fraction waits behind a busy queue. Track p99 storage latency per workload and correlate spikes with CPU, network, and device queue depth.
Kubelet can amplify latency through retry loops, mount reconciliation, and teardown delays when nodes are overloaded or frequently rescheduled. If the node is CPU-constrained, volume operations and I/O completion handling can get delayed, creating tail-latency even with healthy storage. Inspect how the Kubelet Volume Manager behaves during churn, and separate node-local delays from backend response time.
Start by comparing in-pod latency to node-level device latency and backend metrics at the same timestamps. If node device latency is low but app latency is high, suspect CPU scheduling, filesystem, or cgroup throttling. If device latency rises with network signals (RTT, retransmits), suspect transport or target saturation. Always validate with controlled load and consistent queue depth so you’re not measuring self-inflicted queuing.