Packet Loss Impact on Storage Latency
Terms related to simplyblock
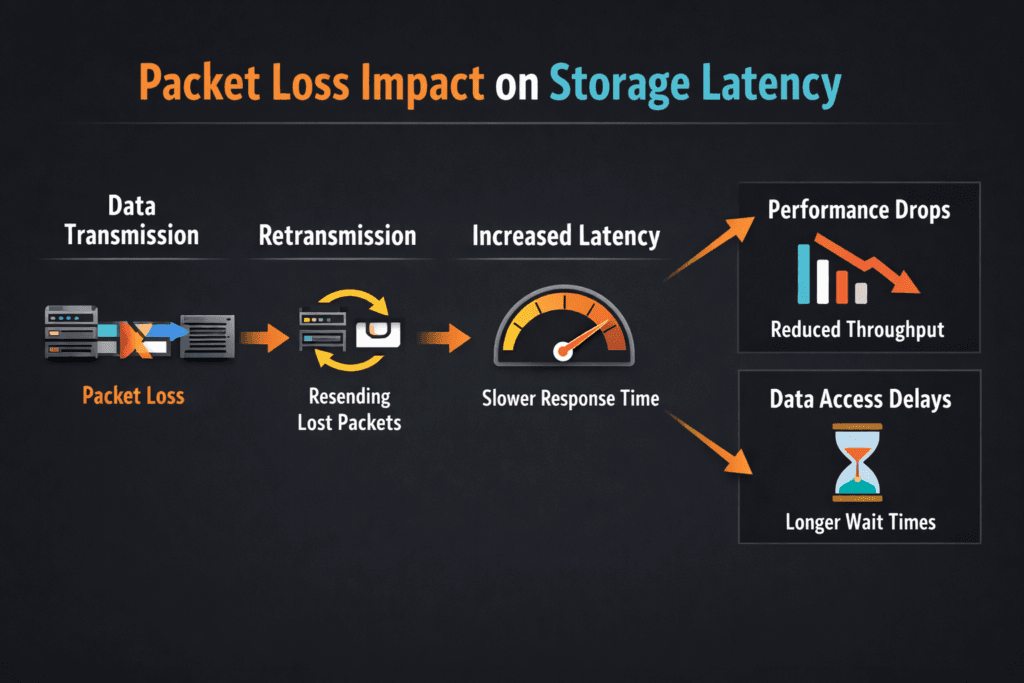
Packet Loss Impact on Storage Latency describes what happens when a storage I/O packet drops on the network, and the system must recover. One lost packet can force retries, reorder work, and stretch completion time for reads and writes. In storage, that stretch often shows up as higher p95 and p99 latency, not just a small dip in throughput.
How packet loss raises latency in storage traffic: reliable transports retransmit. The sender waits for an acknowledgment, and it cannot complete the I/O until the receiver gets the missing data. That wait time stacks on top of normal device latency, so an SSD that responds in microseconds can still feel slow to the application.
Why executives should care: packet loss turns steady service times into latency spikes, and spikes break SLOs. A database can tolerate brief load, but it struggles with long tails, retries, and stalled commits.
Kubernetes Storage makes this even more visible because many pods share the same node, network paths, and storage endpoints. Software-defined Block Storage helps only when the network stays stable, and the platform enforces fair use.
Reducing Packet Loss Across the Storage Fabric
Treat the storage network as part of the storage system, not as “just connectivity.” Small loss rates can still hurt, because storage issues many small I/Os, and each I/O carries a deadline.
Teams usually reduce loss by tightening four areas: link health, congestion, queue behavior, and isolation. Bad optics, a loose cable, or an overloaded TOR switch can create the same user-facing symptom: tail latency. Congestion can also trigger drops during microbursts, even when average utilization looks fine. Bufferbloat adds delay, and then the sender misreads delay as loss.
In a SAN alternative built on Ethernet, isolation matters. A shared network that mixes backup jobs with latency-sensitive volumes invites jitter. Separate VLANs, separate NICs, or dedicated fabrics reduce contention without adding exotic hardware.
🚀 Validate Storage Traffic Paths Before Production Cutover
Use simplyblock docs to plan cluster sizing, NIC layout, and storage networking for Software-defined Block Storage.
👉 Review System Requirements in simplyblock Docs →
Packet Loss Impact on Storage Latency in Kubernetes Storage
Kubernetes Storage adds layers that can hide the real source of loss. A pod shares CPU, the node shares NIC queues, and the CNI can add encapsulation and extra hops. Those hops increase the chance that congestion and drops show up during bursts.
Packet loss also interacts with scheduling. When pods move, flows move. When flows move, paths change. A path change can expose a weaker link, a tighter queue, or a noisy neighbor node.
To keep results stable, align placement with your storage model. Hyper-converged storage can reduce hops by keeping data closer to compute. Disaggregated storage can improve pool efficiency and simplify expansion, but it increases reliance on the fabric. In both cases, Kubernetes Storage needs a clear separation between control traffic and data traffic.
Packet Loss Impact on Storage Latency and NVMe/TCP
NVMe/TCP runs NVMe semantics over standard TCP/IP on Ethernet. That choice supports broad deployment on baremetal, virtual machines, and mixed clusters, but it also inherits TCP recovery behavior. When a packet drops, TCP retransmits, and the I/O waits.
Loss rarely hurts average latency first. Loss usually hits p99 first, because only some I/Os run into retransmits. That tail shift matters for databases, message systems, and metadata-heavy apps that issue many small reads and writes.
RDMA-based NVMe-oF often targets lower CPU use and lower latency, but RDMA fabrics still need tight control. If a team cannot keep the fabric clean, it can trade one kind of pain for another. Many platforms standardize on NVMe/TCP for the default tier, then reserve RDMA tiers for strict latency targets with strong network discipline.
Measuring and Benchmarking Packet Loss Impact on Storage Latency Performance
Measure the application path, not a single host path. Run tests through the same Kubernetes Storage classes and PVCs that production uses, and capture both I/O metrics and network metrics.
Use one clear workload profile per run. Small random I/O exposes tail behavior faster than big sequential streams. Also track CPU, because high CPU load can mimic storage latency, especially with NVMe/TCP.
Use this checklist to keep runs comparable:
- Fix block size, read/write mix, queue depth, runtime, and warm-up time.
- Pin benchmark pods to chosen nodes, and reserve CPU to avoid throttling.
- Record volume mode, because raw block and filesystem paths behave differently.
- Track p50, p95, and p99 latency, plus IOPS and throughput.
- Capture drops, retransmits, and interface errors on both client and storage nodes.
Network and Storage Controls That Cut Latency Spikes
Start with observability that shows loss and latency on the same timeline. If latency rises without loss, the queues or the CPU may drive the issue. If loss rises first, the fabric drives the issue.
Next, isolate traffic. Separate networks for storage data and cluster management reduce cross-talk. Rate limits and QoS policies also help, because they keep a bulk workload from flooding queues.
Finally, review the data path. A user-space, zero-copy design can reduce CPU overhead and reduce jitter under load. SPDK-based designs often help here, especially when the platform pushes high IOPS over NVMe/TCP.
Transport Behavior Comparison for Storage Traffic
The table below summarizes how common storage transports react when the network drops packets.
| Area | NVMe/TCP (TCP/IP) | NVMe/RDMA (RoCEv2, InfiniBand) |
|---|---|---|
| Loss handling | Retransmits, which can stretch tail latency | Often expects a tightly controlled fabric |
| Common symptom | p99 spikes during bursts and congestion | Jitter or stalls if the fabric is mis-tuned |
| Ops profile | Familiar tooling, easier rollout | More tuning, deeper NIC and switch work |
| Fit in Kubernetes | Strong default tier for broad clusters | Best for strict latency tiers with stable networking |
Simplyblock™ Guidance for Low-Loss Storage Latency
Simplyblock™ targets stable service times for Kubernetes Storage, even when multi-tenant clusters push mixed workloads. It delivers Software-defined Block Storage with support for NVMe/TCP and NVMe/RoCEv2, so teams can tier workloads without changing the storage control plane.
Simplyblock uses an SPDK-based, user-space, zero-copy data path to reduce overhead in the hot path. That matters when NVMe/TCP runs at scale, because CPU and jitter can become the real limiter before SSDs do. Multi-tenancy and QoS help keep one tenant from turning small loss events into platform-wide tail latency.
Deployment choice also matters. Simplyblock supports hyper-converged, disaggregated, and hybrid layouts, so teams can match the fabric design to the workload and risk profile.
Where Loss-Aware Storage Networking Goes Next
Teams increasingly treat packet loss as an SLO input, not a network footnote. Platforms now correlate loss, queue depth, and tail latency to catch issues before they hit customer traffic.
Hardware offload will also play a larger role. DPUs and IPUs can shift data-path work off host CPUs, which can reduce jitter during bursts. Storage stacks that pair NVMe/TCP with efficient user-space I/O can narrow the gap between “easy to run” and “fast under pressure.”
Related Terms
Teams often review these glossary pages alongside Packet Loss Impact on Storage Latency.
Tail Latency
Observability
NVMe Latency
Disaggregated Storage
Questions and Answers
Packet loss forces retransmissions, which turn a single I/O into multiple network round-trip and inflate queueing on both the initiator and the target. That extra waiting time shows up first as p95/p99 spikes, not as a smooth slowdown. On NVMe/TCP fabrics, a tiny loss rate can cascade into head-of-line blocking and jitter that looks like “random storage stalls.” See storage latency.
For latency-sensitive block storage, even low loss can be problematic because retransmits arrive on the critical path of completions. The practical threshold is when p99 starts rising faster than throughput improves under the same load, because that means queues are building behind missing segments. Measure under peak concurrency and watch whether tail latency recovers quickly after microbursts or stays elevated.
Most I/Os complete normally, so the average stays deceptively stable. The unlucky fraction hits retransmit timers, reorder delays, or congested queues and becomes the “tail” that blocks everything behind it. Apps feel that tail as timeouts, slow commits, or uneven pod performance. This is exactly what NVMe over TCP latency characteristics warn about: small fabric issues can dominate user experience.
Congestion is sustained oversubscription that grows queues and increases latency; packet loss is the symptom when buffers overflow, or the fabric drops frames. Congestion can hurt even without loss because queues add delay, but loss is worse because it triggers retransmission and recovery logic. In storage, both effects stack: queues slow completions, then retransmits slow them again, multiplying tail latency.
Start by preventing microbursts and oversubscription: right-size uplinks, avoid hot-spots, and keep NIC queues from saturating. Then enforce QoS so storage traffic isn’t competing with noisy east-west workloads, and verify congestion control is consistent end-to-end. If you run RDMA-capable environments, data center bridging (DCB) is one approach to reduce drops and stabilize tail latency under load.