CPU vs Network Bottlenecks in NVMe/TCP
Terms related to simplyblock
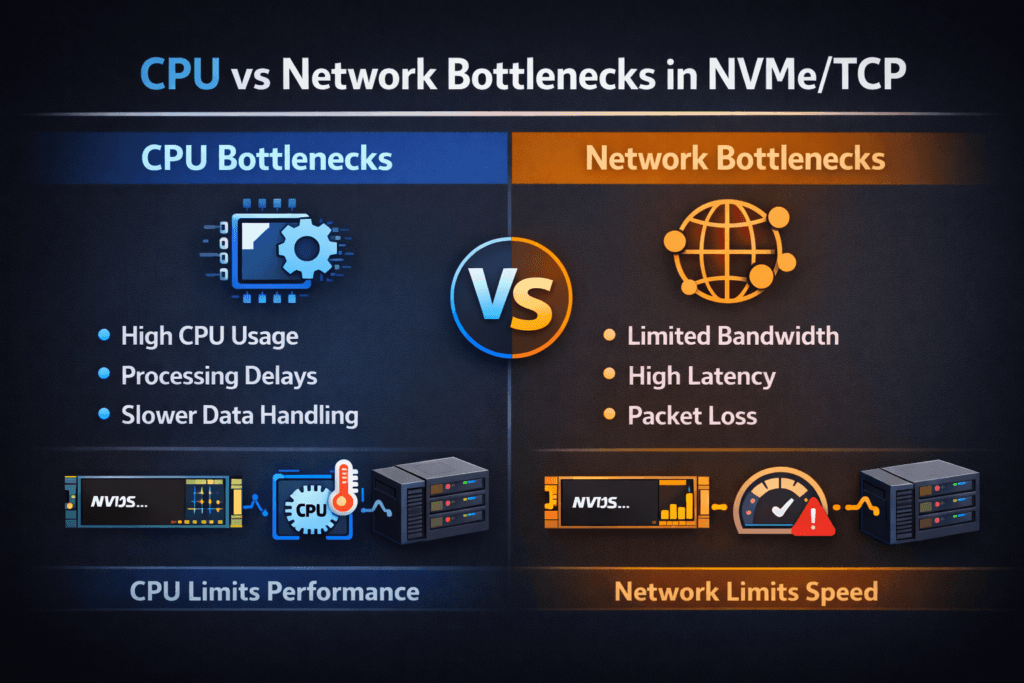
CPU vs network bottlenecks in NVMe/TCP describes where performance “tops out” first when hosts access remote NVMe namespaces over Ethernet. Some environments hit a network ceiling (link rate, packet loss, or switch congestion). Others hit a CPU ceiling (per-packet work, interrupts, copies, or TLS overhead). The bottleneck choice changes the fix, the cost profile, and the scaling plan.
How do you tell the difference quickly? Watch what rises first as the load increases. When CPU becomes the limit, you see high system time, hot softirq threads, rising context switches, and lower IOPS per core. When the network becomes the limit, you see line-rate saturation, growing retransmits, queue drops, and latency spikes that track link pressure.
Why does this matter to executives? Bottlenecks drive capex decisions. If CPU caps throughput, you may waste money on faster links. If the network caps throughput, adding cores will not protect p99 latency. A clean answer helps leaders choose a SAN alternative strategy built on Software-defined Block Storage without guessing.
Separating compute limits from fabric limits
Start with a clear I/O profile and a firm latency target. Random 4K reads, mixed workloads, and sequential writes stress different parts of the stack. Then map utilization across the host, NIC, and storage target.
Host-side work often dominates at small I/O sizes. NVMe/TCP runs over the TCP stack, so the host pays for segmentation, checksum work, memory copies, and scheduling. That cost can crowd out Kubernetes Storage workloads on the same node, especially on bare-metal clusters that already run dense east–west traffic.
Network-side limits show up when the link approaches saturation or when the fabric drops packets. Congestion adds queueing delay, and TCP recovery adds more delay. Tail latency grows fast once buffers fill, even if average latency looks fine.
🚀 Validate NVMe/TCP Queueing at the Namespace and Subsystem Layer
Use simplyblock NVMe-oF subsystem and namespace details to reason about connections, queues, and scaling behavior in disaggregated designs.
👉 Read NVMe Namespaces and Subsystems →
CPU vs Network Bottlenecks in NVMe/TCP in Kubernetes Storage
Kubernetes Storage adds a shared-resource layer that makes bottlenecks easier to trigger. Pods compete for CPU time, IRQ handling, and cache. Node-level throttling can also hide the real ceiling because the workload hits a CPU limit before it reaches the storage or network limit.
Scheduling choices matter. Pinning the storage data path to stable cores can cut jitter. Spreading interrupts across cores can also help, but only when you keep cache locality intact. When a cluster runs multi-tenant workloads, a “noisy neighbor” can steal CPU cycles needed for the NVMe/TCP path and push other volumes into high p99.
Software-defined Block Storage can reduce this risk when it enforces per-volume QoS and tenant isolation. The platform then controls contention at the layer that actually saturates, instead of relying only on best-effort node sharing.
CPU vs Network Bottlenecks in NVMe/TCP: What the Transport Adds
NVMe/TCP keeps the NVMe command model over standard Ethernet, which makes it attractive for disaggregated storage and large Kubernetes Storage fleets. At the same time, TCP adds work that local NVMe does not require.
CPU bottlenecks often show up first in these patterns:
- small I/O, high IOPS
- many connections per host
- heavy encryption or integrity features
- Oversubscribed nodes that run both apps and storage services
Network bottlenecks often show up first in these patterns:
- large sequential I/O that chases bandwidth
- shared uplinks that carry storage and service traffic
- fabrics that drop packets under burst load
- congested top-of-rack designs with shallow buffers
This split explains why two clusters can report the same “NVMe media speed,” yet deliver very different outcomes over NVMe/TCP.
Measuring CPU vs Network Bottlenecks in NVMe/TCP Performance
A good test answers one question: “Which resource caps throughput at the latency target?” Run synthetic tests to map ceilings, then confirm results with an application run that matches production I/O.
Use one repeatable checklist to keep runs comparable:
- Fix the workload shape (block size, read/write mix, and access pattern), then change only concurrency.
- Track p50, p95, and p99 latency, plus IOPS stability over time.
- Capture CPU user time, system time, softirq load, and context switches on the host.
- Capture NIC throughput, drops, and retransmits, and correlate them with latency.
- Repeat tests during background activity (rebuild, resync, or snapshots) to expose worst-case behavior.
When CPU caps performance, throughput flattens while CPU climbs, and latency starts to wobble. When the network caps performance, throughput flattens near link rate while drops and retransmits rise, and tail latency spikes.
Fixes that cut CPU cost and network queues
Tackle the bottleneck you measured, not the one you assumed. If CPU caps throughput, reduce per-I/O overhead and remove kernel work where possible. SPDK-based user-space I/O paths can cut context switches and copies, which often improves IOPS per core and reduces jitter. DPUs and IPUs can also offload packet and storage tasks, which frees the host CPU for applications.
If the network caps throughput, improve fabric behavior. Separate storage traffic from chatty service traffic, reduce oversubscription on critical links, and tune for low loss. Raising link speed helps only when congestion and drops stop driving tail latency. QoS policies matter here as well, because they prevent one workload from filling queues that others depend on.
CPU and network symptoms side by side
The table below highlights common symptoms, the fastest checks, and the most common first fixes.
| Primary limit | What you see first | Fastest check | Typical first fix |
|---|---|---|---|
| CPU | rising system time, hot softirq, falling IOPS per core | Both CPU and link climb, p99 rises early | reduce copies, pin cores, use SPDK-style paths, consider offload |
| Network | near line-rate, rising drops or retransmits, jumpy p99 | correlate p99 with NIC drops and retransmits | separate traffic, raise headroom, tune fabric, apply QoS |
| Mixed | Fix CPU hot spots first, then remove network loss | step-load tests with full telemetry | fix CPU hot spots first, then remove network loss |
Simplyblock™ controls for lower overhead and cleaner isolation
Simplyblock provides Software-defined Block Storage with NVMe/TCP and NVMe/RoCEv2 support, so teams can pick Ethernet-first transport where it fits and move latency-sensitive tiers to RDMA without swapping the storage layer. Simplyblock also uses an SPDK-based, user-space, zero-copy architecture, which targets higher IOPS per core and lower jitter under concurrency.
Kubernetes Storage teams benefit from flexible deployments across hyper-converged, disaggregated, and hybrid designs. That flexibility supports platform teams who want local performance for some services and shared pools for others. Multi-tenancy and QoS help keep one namespace from consuming the CPU budget, the queue budget, or the bandwidth budget that another workload needs.
Next steps for offload, observability, and policy
NVMe/TCP optimization is moving toward tighter coupling between telemetry and control. More platforms will adjust limits based on p99 behavior, CPU headroom, and fabric congestion, instead of relying on static tuning. Offload adoption will also grow as DPUs and IPUs become a standard part of high-density clusters.
Expect more emphasis on per-tenant policy, because shared Kubernetes Storage environments need guardrails that survive reschedules and burst load.
Related Terms
Teams often review these glossary pages alongside CPU vs Network Bottlenecks in NVMe/TCP.
Questions and Answers
If IOPS/throughput plateaus while initiator CPU (softirq/ksoftirqd, NIC interrupts) climbs and p99 latency rises, you’re likely CPU-bound in the TCP/IP and NVMe stack. If CPU stays flat but RTT, retransmits, or switch port utilization spikes, you’re likely network-bound. The key is correlating p99 latency with CPU saturation vs link/packet signals during the same load window.
Target CPU bottlenecks show up as rising completion latency and queueing at the target even when the network path is clean. You’ll often see throughput flatten, p99 increase, and target CPU cores pinned in networking + NVMe processing while links are not fully utilized. This commonly appears when many hosts connect with high parallelism and the target spends more time on packet processing than on media I/O.
Increasing queue depth raises in-flight I/O, which can push TCP processing into a CPU wall before you saturate the link. When that happens, more depth only adds host-side queuing and tail latency without increasing throughput. A practical heuristic is: if bandwidth doesn’t rise but CPU and p99 do, you’re feeding the CPU bottleneck, not the network. See fio queue depth tuning for NVMe for the correct sweep method.
At high rates, TCP segmentation, checksum offloads, interrupt moderation, and per-connection processing can dominate. If RSS/affinity is poor or the workload fans in/out across too many queues, you get cache misses and softirq contention that caps throughput well below link speed. That’s why NVMe/TCP performance often hinges on host networking tuning as much as the storage target. The transport context is covered in NVMe over TCP.
Run the same workload at fixed iodepth and block size, then vary one dimension: link speed (or traffic shaping) and CPU headroom (pinning/isolcpus or reducing other workloads). If reducing available bandwidth lowers throughput linearly with a stable CPU, you’re network-bound. If adding bandwidth doesn’t help but freeing CPU does, you’re CPU-bound. Track p99 storage latency to confirm you’re not “winning” throughput by sacrificing tail behavior.