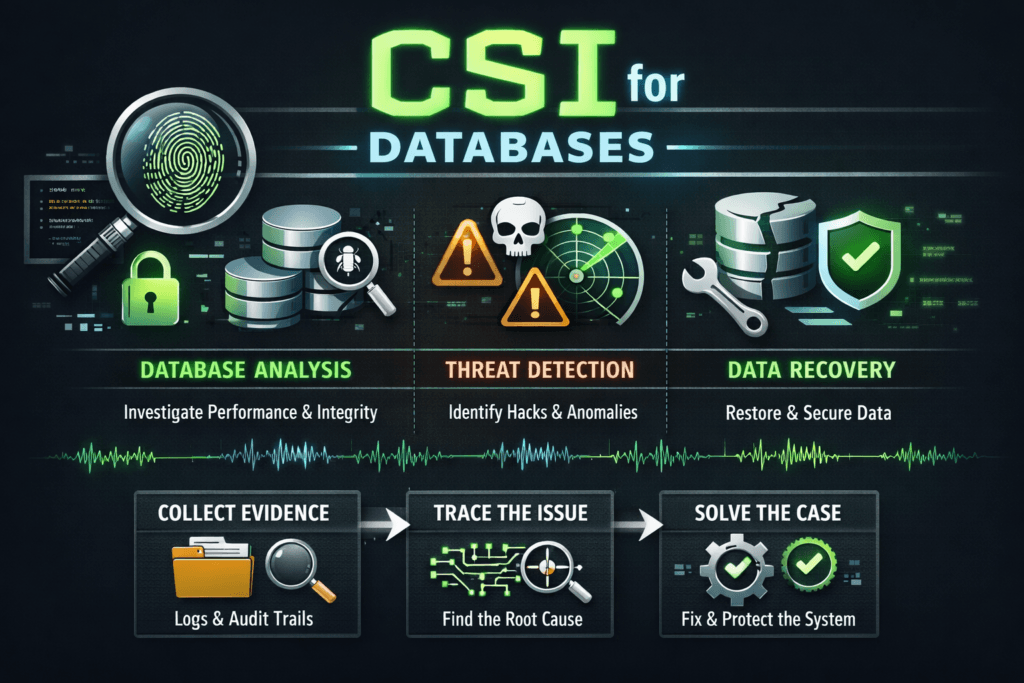
CSI for Databases
Terms related to simplyblock
CSI for Databases describes how the Container Storage Interface (CSI) connects stateful database pods to persistent volumes in Kubernetes. It defines how Kubernetes requests storage, how the CSI driver provisions volumes, and how nodes attach and mount them so a database can read and write data with stable latency.
Database teams care about CSI because storage behavior shows up directly in commit latency, compaction time, checkpoint duration, and recovery speed. Platform teams care because CSI drives day-two operations like resizing, snapshots, clones, and failover workflows. The strongest outcomes come from aligning CSI choices with Kubernetes Storage realities, using Software-defined Block Storage controls for QoS and isolation, and selecting a fast datapath that holds up under contention. NVMe/TCP matters here because it can deliver high throughput and predictable latency over standard Ethernet when the storage backend implements it efficiently.
Designing CSI workflows for stateful reliability
CSI adds a contract between Kubernetes and the storage backend, but databases still need careful handling of ordering, durability, and recovery steps. A well-run setup keeps volume lifecycle events predictable, including provisioning time, attach time, mount stability, and resize behavior. It also keeps operational actions safe, so platform changes do not break the database’s write path.
When teams troubleshoot database incidents in Kubernetes, they often find one of three root causes: unstable attachment flows, inconsistent performance during shared-node contention, or slow recovery after rescheduling. You can reduce all three by standardizing StorageClasses, enforcing QoS at the volume layer, and instrumenting the full request path from the PVC to the device.
🚀 Run Apache Cassandra with CSI-Backed NVMe/TCP Volumes
Use Simplyblock to reduce tail latency, speed up compaction, and scale storage without downtime.
👉 Use Simplyblock for Cassandra Storage on Kubernetes →
CSI for Databases in Kubernetes Storage
Kubernetes moves pods, drains nodes, and reschedules workloads, so databases face frequent lifecycle transitions. CSI must handle these transitions without surprises. The controller-side flow provisions and manages volumes, while the node-side flow mounts and exposes them to the kubelet. For databases, attach and mount reliability matters as much as peak IOPS because any delay can stretch RTO during failover.
A database-friendly pattern ties StorageClasses to workload intent. One class can target low-latency OLTP volumes with strict QoS. Another class can serve backups and analytics with capped throughput. This approach helps the platform team keep a single operational model while letting database owners pick predictable behavior through configuration instead of tickets.
To keep database performance consistent, teams typically watch p95 and p99 latency, not just averages. They also track the time from scheduling to ready state because that timing drives recovery during rolling upgrades and node failures.
CSI for Databases and NVMe/TCP
CSI operates at the control plane level, but transport and datapath choices shape the database’s real experience. NVMe/TCP can support strong performance on standard networks, and it scales well in disaggregated layouts where compute and storage scale independently. That combination fits database fleets, where you want to add capacity and performance without rebuilding the cluster.
NVMe/TCP also raises a practical requirement: CPU efficiency. If the storage path burns too much CPU per I/O, latency variance grows under load, especially when multiple tenants share nodes. A user-space datapath based on SPDK-style concepts can reduce overhead, which helps database workloads maintain predictable tail latency during spikes.
What to measure for database-grade CSI outcomes
Database-grade CSI measurement focuses on two categories: lifecycle timing and steady-state behavior. Lifecycle timing includes PVC-to-bound time, attach time after scheduling, mount time, and recovery time after rescheduling. Steady-state behavior includes IOPS, throughput, average latency, and p95/p99 latency, measured at both the storage device and the database layer.
You will get a better signal if you test with realistic patterns. Use a write-heavy workload for WAL or commit logs, a mixed workload for OLTP, and a read-heavy workload for analytics scans. Correlate storage metrics with database metrics like commit latency, compaction duration, and checkpoint timing. This correlation helps you see when storage jitter turns into database timeouts.
Practical steps that improve CSI behavior for databases
Most improvements come from controlling variability rather than chasing a single peak benchmark.
- Standardize StorageClasses that map to database intents, and enforce QoS at the volume layer.
- Use topology-aware placement so volumes stay close to the workload and avoid cross-zone penalties.
- Keep resize, snapshot, and clone operations predictable by defining clear maintenance windows and limits.
- Separate noisy jobs, such as backups and analytics, from low-latency tiers using policy and pool design.
- Instrument the full path from PVC events to node mount events, and alert on drift in attach and mount times.
CSI Patterns for Database Workloads Compared
The table below compares common CSI approaches for database fleets, based on operational reliability and performance predictability.
| Approach | Operational Predictability | Performance Consistency | Best Fit |
|---|---|---|---|
| Basic CSI with best-effort settings | Medium | Medium | Dev and test databases |
| CSI with volume-level QoS policies | High | High | Shared production clusters |
| CSI with topology-aware placement | High | High | Multi-zone and edge deployments |
| CSI with snapshot and clone automation | High | Medium–High | CI, staging, and data refresh workflows |
| CSI backed by efficient user-space datapath | High | High | Latency-sensitive OLTP at scale |
Predictable Database Volumes Through Simplyblock™ CSI Operations
Simplyblock™ runs a high-performance storage backend for Kubernetes using an SPDK-based, user-space architecture and NVMe/TCP support. This design targets CPU efficiency and stable tail latency, which database platforms rely on for predictable commit behavior and consistent throughput under load.
Simplyblock also aligns well with Software-defined Block Storage requirements for database fleets. It supports policy-driven operations, including volume provisioning, snapshots, clones, and resizing workflows that platform teams use to standardize day-two operations. For shared clusters, simplyblock’s multi-tenancy and QoS controls help prevent one workload from degrading others, which protects database SLOs during bursty periods.
Future directions for CSI and database platforms
Platform teams are tightening the link between Kubernetes intent and storage policy, so database classes map to enforced limits by default. More organizations will adopt DPUs and IPUs to offload parts of the data path, reduce CPU burn, and isolate traffic earlier. Database SRE teams are also raising the bar on p99 and p999 targets because those metrics drive user experience and executive dashboards.
Related Terms
Teams often review these glossary pages alongside CSI for Databases.
- CSI Control Plane vs Data Plane
- CSI Resize Controller
- CSI NodePublishVolume Lifecycle
- CSI Snapshot Controller
Questions and Answers
Many databases prefer raw block when they manage their own I/O patterns and durability, because it avoids filesystem metadata overhead and can reduce latency variance. Filesystem mode is simpler operationally, especially for backups and tooling, but it can add jitter under high write concurrency. The best choice depends on WAL/redo behavior, sync settings, and how your DB handles alignment and caching. Kubernetes Volume Mode (Filesystem vs Block) is the key decision point.
Databases are sensitive to p99 latency spikes, so performance isolation matters more than peak IOPS. Use per-volume QoS/limits, separate storage pools for hot DB workloads, and ensure the storage stack throttles background work (rebuild/GC/compaction) to protect tail latency. Monitor per-tenant or per-volume latency histograms and correlate spikes with shared resource saturation. This maps directly to performance isolation in multi-tenant storage.
Most DB “won’t start” cases after node churn are not provisioning issues; they’re mount/publish or cleanup drift. If a pod is stuck in ContainerCreating, it’s often NodePublish/NodeUnpublish failing due to a stale mount, device busy state, or leftover lock files. For databases, this is painful because it extends recovery time and can trip liveness probes. Use the CSI NodePublishVolume lifecycle to pinpoint whether the failure is staging, publishing, or teardown.
CSI snapshots are usually crash-consistent unless you add application quiesce, so treat them as a storage primitive, not a full DB backup strategy by default. For consistent restores, coordinate snapshots with DB flush/checkpoint, or pair them with logical backups for point-in-time recovery. Also, validate restore time and whether clones are copy-on-write or full copy, because that changes recovery performance and space use.
For databases, watch p95/p99 write latency, fsync/flush latency, queueing depth, and throttling events rather than average throughput. A flat IOPS chart can still hide tail latency that slows commits and increases replication lag. When debugging, separate node bottlenecks (CPU/IRQ, filesystem, kubelet) from storage bottlenecks (device busy, backend saturation) so you tune the right layer instead of masking the symptom.