Database IO Patterns
Terms related to simplyblock
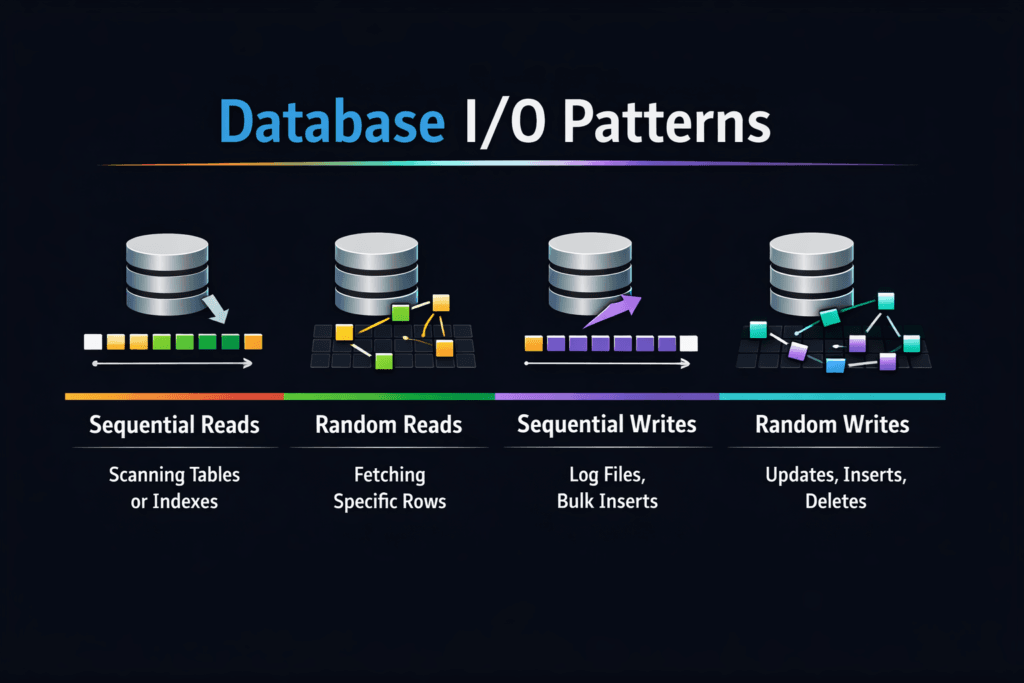
Database IO Patterns describe how a database reads and writes data over time. These patterns shape latency, throughput, and the cost of the storage stack. A database rarely runs a single I/O type. It mixes small random reads, small random writes, larger sequential log writes, and periodic background work such as compaction, checkpointing, and replication.
Three traits show up in most engines. First, OLTP workloads drive 4K–16K random I/O and stress IOPS and p99 latency. Second, write-ahead logging pushes steady, sequential writes and forces sync points that expose storage jitter. Third, background jobs create bursts that compete with foreground traffic. That mix explains why a storage system can look “fast” in a lab and still fall over during a traffic spike.
For executives, the key question is simple: Will the storage layer keep response times stable as concurrency rises? For operators, the key task is also clear: map database behavior to storage controls in Kubernetes Storage and in Software-defined Block Storage.
Optimizing Database Workload I/O with Current Platforms
A good storage design starts with the database path, not the device datasheet. Databases care about latency variance and queueing behavior more than raw peak bandwidth. A system that holds p99 steady often beats a system that wins only at p50.
Software-defined Block Storage can help when it enforces policy at the right level. Strong platforms isolate tenants, limit noisy neighbors, and protect foreground I/O during background churn. They also expose clear metrics, so teams can tie storage events to query latency.
CPU cost matters, too. Each I/O needs work in the host, the kernel, the network stack, and the target. User-space, zero-copy designs reduce that per-I/O cost, which frees cores for query execution and keeps jitter down when concurrency climbs.
🚀 Keep Multi-Tenant Database Storage from Becoming a Noisy-Neighbor Problem
Use Simplyblock QoS controls to protect commits and reads on Software-defined Block Storage.
👉 Use Simplyblock for Storage Policy and Isolation →
Database IO Patterns in Kubernetes Storage
Kubernetes Storage adds moving parts that change how database I/O behaves. Pod placement can add network hops, and those hops can add jitter. CSI settings, volume mode, and mount options can also shift results in ways that surprise teams.
Databases also react to cluster events. A node drain can trigger rescheduling, and rescheduling can coincide with cache warm-up and log replay. That timing pushes extra reads and writes through the storage layer. If the platform cannot preserve priorities, the database sees spikes, and the application sees slow requests.
Teams get the best outcome when they align storage topology to the workload. Hyper-converged layouts can reduce hops for some paths. Disaggregated storage can separate fault domains and scale I/O without scaling compute. Either model can work, but Kubernetes Storage needs strong controls to keep p99 stable.
Database IO Patterns and NVMe/TCP
NVMe/TCP matters because it delivers high parallelism over standard Ethernet. That helps database workloads that issue many small I/Os and keep multiple queues busy. It also fits bare-metal fleets that want performance without adding specialized network gear.
Database logs and checkpoints can saturate links, while random reads can saturate the CPU. NVMe/TCP setups often hit one of those limits first, depending on block size and concurrency. A platform with efficient queues and low copy overhead can move more I/O per core, which helps both OLTP traffic and log-heavy write bursts.
NVMe/TCP also supports scale-out growth. Teams can add nodes, spread load, and keep the data path consistent. That approach aligns well with Software-defined Block Storage as a SAN alternative.
Measuring and Benchmarking Database IO Patterns Performance
A useful benchmark answers two questions: what does the database do, and what does the storage layer deliver under that mix? Start with the database behaviors that drive user pain. Focus on p95 and p99, not just averages.
To keep tests honest, avoid shortcuts. Use working sets that exceed the cache. Run long enough to reach a steady state. Track queue depth, CPU use, and network use, not only IOPS. When a database slows down, queueing and jitter usually explain the drop faster than peak throughput numbers.
A simple executive scorecard works well: p99 latency, log flush time, and sustained IOPS under load. Those three signals map to end-user response time, commit rate, and headroom.
Approaches for Improving Database Storage Behavior Under Load
Use a small set of changes, then validate each one under production-like concurrency. One change that helps at low load can hurt at high load.
- Match block sizes and concurrency to the database path, then confirm p99 stays within SLOs.
- Cap background work, such as compaction or rebuild tasks, so foreground reads and commits keep priority.
- Use QoS and tenant isolation to stop one workload from consuming the entire I/O budget.
- Keep topology stable in Kubernetes, so tests remain comparable across runs and nodes.
- Watch CPU and network headroom in NVMe/TCP paths, because both can cap real output.
I/O Outcomes Across Storage Designs
The table below summarizes how common storage designs usually respond to database-heavy I/O mixes. Use it to line up architecture choices with OLTP, log writes, and background churn.
| Storage Design | Strength for OLTP Random I/O | Strength for Log Writes | Common Failure Mode | Fit in Kubernetes Storage |
|---|---|---|---|---|
| Local NVMe (direct attached) | Very strong latency | Strong per node | Hard to share and fail over | Good for node-local state with careful ops |
| Distributed Software-defined Block Storage | Scales with nodes and policy | Strong if network stays clear | Hotspots without QoS | Strong for multi-tenant clusters |
| Legacy SAN-style array | Consistent until controller limits | Good streaming writes | Controller queueing | Works, but scale can cost more |
| Disaggregated NVMe/TCP pool | Strong with tuned hosts | Strong if links allow | Network saturation | Clean separation of compute and storage |
Simplyblock™ Controls for Database Workloads
Simplyblock™ targets high I/O density in Kubernetes Storage by combining NVMe/TCP transport with a user-space data path. That design reduces per-I/O overhead, which helps keep jitter down when concurrency rises. It also fits Software-defined Block Storage goals because it supports multi-tenant policy and QoS controls that protect critical volumes during background churn.
Operators often see the hardest failures during mixed load. A backup job, a compaction wave, and a traffic spike can overlap. Simplyblock focuses on control points that keep the database path stable during those overlaps, including workload-aware policies across hyper-converged and disaggregated deployments.
Upcoming Changes in Database I/O
Database engines keep adding features that change I/O behavior. LSM-based systems push compaction and write amplification into the spotlight. Distributed SQL systems add replication traffic and cross-node read paths that stress the network.
Storage stacks also evolve. More teams use user-space I/O paths, tighter CPU pinning, and better NUMA alignment to reduce jitter. DPUs and IPUs can offload parts of the data path, which leaves more CPU for query work. NVMe/TCP remains a key option because it keeps the network plan simple while still supporting high parallelism.
Related Terms
Teams often review these glossary pages alongside Database IO Patterns.
Questions and Answers
Most databases mix small random reads for indexes, bursty random writes for pages, and sequential log writes for durability. The profile shifts with cache hit rate, compaction, and checkpointing, so “read-heavy” can still be write-intensive at the device. Model concurrency and tail latency, not just average IOPS, because a small percent of slow I/Os often dictates throughput and user-facing timeouts.
Log devices see mostly sequential appends plus frequent fsyncs, so they are latency-sensitive even when throughput is low. Data files see more random I/O, especially under cache misses and index lookups. If WAL fsync slows down, commit latency rises immediately, while data-file slowness may show up as query stalls. This is why write-ahead logging is a key storage design input.
Databases can turn one user write into many backend writes through page rewrites, journaling, checkpoints, compaction, and read-modify-write behavior. That increases device wear and pushes p99 latency up during GC or rebuild phases, even if the app write rate is steady. When tuning, track physical bytes written and latency under sustained load, not just logical throughput. This is the core of write amplification.
When the working set exceeds memory, the database must fetch scattered pages and index blocks, shifting the profile toward small random reads and increasing queueing. That also triggers more background writes (evictions, dirty page flush), which compete with foreground reads. The result is a sharp rise in tail latency, where a few slow reads stall transactions and hold locks longer.
Every extra millisecond stretches the time a transaction holds locks while waiting on reads, log flushes, or page writes. That reduces concurrency headroom, backs up connection pools, and makes timeouts more likely even if the CPU is idle. If you only watch average latency, you’ll miss the p99 spikes that dictate user experience. This causal chain is explained in the storage latency impact on databases.