Network Storage Performance
Terms related to simplyblock
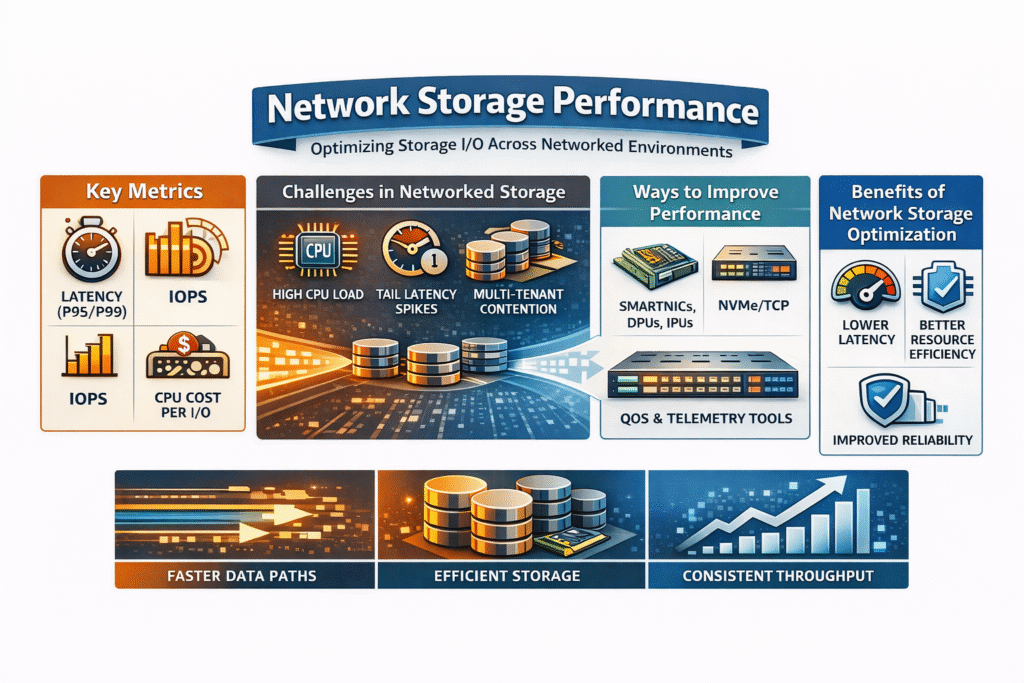
Network Storage Performance describes how fast and how consistently systems complete storage I/O when data travels over a network. Teams track latency (including p95 and p99), IOPS, throughput, and CPU cost per I/O because one headline metric can hide risk during spikes.
Tail latency often drives end-user impact, since brief p99 jumps can trigger retries, timeouts, and stalled transactions. In Kubernetes Storage, scheduling, rebuild traffic, and multi-tenant contention can change these numbers quickly, so teams need repeatable tests and clear per-volume visibility.
Network Storage Performance in I/O-heavy environments
Most performance issues come from contention across the full path. Hosts spend CPU cycles on packet work, encryption, policy checks, and telemetry, while the same CPUs run databases and stateful services. That shared budget drives p99 latency up, especially in multi-tenant clusters where one tenant can pressure shared queues.
Network design adds its own tax. Oversubscription, buffer pressure, and mixed east-west traffic raise jitter long before average latency changes. MTU drift across switches, uneven routing, and noisy neighbors can turn a stable volume into an unstable one.
Kubernetes Storage makes this visible because scheduling shifts, pods, changes traffic patterns, and stacks sidecars and agents on the same nodes. Rebuilds and resync activity can also collide with peak hours and push tail latency higher.
🚀 Run NVMe/TCP storage with performance-focused Kubernetes design
Use simplyblock to deliver Software-defined Block Storage for Kubernetes Storage with multi-tenancy and QoS.
👉 Learn how NVMe/TCP fits SAN alternative designs
NVMe/TCP behavior on Ethernet storage fabrics
NVMe/TCP carries NVMe commands over standard TCP/IP networks, so teams can use routable Ethernet and common ops tooling. That makes it practical for disaggregated storage and SAN alternative designs that need scale without a dedicated storage fabric.
TCP still costs CPU at high IOPS. The host handles segmentation, checksum work, and often encryption, while observability agents add more overhead. A user-space I/O path can reduce that cost by cutting context switches and by avoiding interrupt-heavy behavior.
When you size for NVMe/TCP, treat CPU and network headroom as first-class resources. Validate p99 during mixed workloads, not only during single-job tests.
Kubernetes Storage architectures where performance matters
Kubernetes Storage teams typically choose hyper-converged, disaggregated, or mixed layouts. Hyper-converged designs keep compute and storage on the same nodes, which cuts hops, but it also increases CPU contention during bursts. Disaggregated designs separate storage nodes from app nodes, which shifts pressure to the network path and makes fabric behavior the key variable. Mixed designs let teams place “hot” workloads close to storage while keeping growth flexible.
Kubernetes relies on PersistentVolumes, StorageClasses, and CSI to provision and attach storage, so the storage layer has to keep performance steady while Kubernetes reschedules pods.
How to measure network storage performance in practice
Executives should ask for results that show p50, p95, and p99 latency, not only averages. Ops teams should capture IOPS and throughput alongside client CPU use and storage-node CPU use because CPU saturation can mimic a network issue. A solid test plan states block size, read/write mix, queue depth, job count, and run time so teams can repeat results across clusters.
fio helps model common profiles such as 4K random reads, 4K random writes, and 128K sequential reads. Start with a single-volume run, then run multi-volume tests across nodes to expose noisy-neighbor behavior and QoS gaps. Track p99 during resync or rebuild activity to see how the platform behaves under real pressure.
Comparison of approaches to improving Network Storage Performance
Teams improve Network Storage Performance by reducing CPU waste, controlling contention, and choosing a transport that fits the fabric. The table below summarizes common options and what they change in real clusters.
| Option | Where the bottleneck shifts | Typical impact on p99 latency and cost | Operational complexity |
| CPU-only tuning (kernel path) | Host CPU and kernel | Helps short-term, but contention returns as workloads scale | Low to medium |
| SmartNIC feature offloads | NIC handles select functions | Improves specific tasks, but most I/O work stays on the host | Medium |
| DPU/IPU offload | On-card compute runs infra services | Protects host CPU headroom and helps isolation under load | Medium to high |
| NVMe/TCP with user-space data path | Less kernel overhead per I/O | Improves p99 stability and node density on standard Ethernet | Medium |
| NVMe/RDMA (RoCE/IB) | Fabric and NIC features carry more work | Lowest latency potential, but fabric tuning burden rises | High |
What the storage layer must still provide
Transport choice alone does not deliver predictable results. The storage platform must manage volume lifecycle, snapshots and clones, and resilience through replication or erasure coding. It also needs enforceable QoS so one tenant cannot starve others, plus clear telemetry that ties network health to volume-level latency.
Kubernetes Storage adds more operational needs. CSI-driven provisioning has to behave the same way across upgrades, node drains, and reschedules. Rebuild and resync work should not crush p99 for production volumes.
Simplyblock™ for predictable Network Storage Performance
Simplyblock pairs NVMe/TCP support with an SPDK-based user-space design to reduce kernel overhead and keep CPU use steady under load. That approach supports higher pod density and more stable p99 latency in multi-tenant Kubernetes Storage clusters, especially when teams enforce QoS and service classes.
Simplyblock supports hyper-converged, disaggregated, and hybrid deployments, which helps teams match architecture to growth and failure domains. It also positions as a SAN alternative by delivering Software-defined Block Storage with cloud-native operations instead of appliance-led workflows.
Related Technologies
Teams often review these glossary pages alongside Network Storage Performance when they set measurable targets for Kubernetes Storage and Software-defined Block Storage.
IOPS (Input/Output Operations Per Second)
NVMe Latency
RDMA (Remote Direct Memory Access)
Service Level Agreement (SLA)
AI Storage Companies
Data center bridging (DCB)
NIC (Network Interface Card)
Questions and Answers
Network storage performance depends on IOPS, latency, throughput, and protocol overhead. Using modern protocols like NVMe over TCP and reducing CPU load through DPUs or IPUs can significantly boost these metrics.
NVMe/TCP delivers higher IOPS, lower latency, and better throughput than legacy protocols like iSCSI. It uses standard Ethernet and runs efficiently over commodity networks, making it ideal for high-performance workloads.
You can benchmark network storage performance in Kubernetes using tools like FIO, and monitor IOPS, throughput, and latency. Pairing this with topology-aware scheduling and node affinity helps ensure accurate results.
Yes, offloading storage protocols like NVMe-oF to DPUs reduces host CPU usage and latency. This enables faster storage access, improved multi-tenancy, and better scalability in cloud-native or virtualized environments.
Databases and analytics platforms are I/O-intensive and depend on low-latency, high-throughput storage. Optimizing network storage performance ensures fast query response times and consistent application behavior, especially in Kubernetes deployments.