NVMe-oF Scaling Characteristics
Terms related to simplyblock
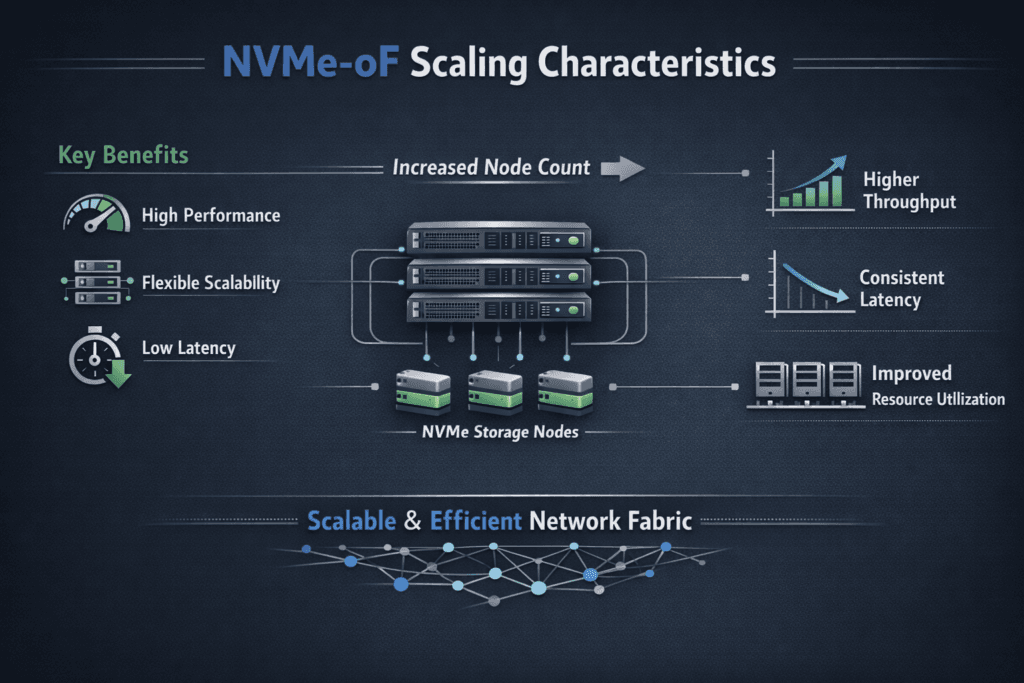
NVMe-oF scaling characteristics describe how performance and efficiency change as you add hosts, targets, namespaces, and network capacity. Strong scaling keeps p99 latency stable while throughput rises, and it avoids a steep increase in CPU per I/O. Weak scaling shows up as queue buildup, retransmits, and noisy-neighbor effects that spread across tenants.
Scaling pressure usually hits three layers at once: host CPU and queueing, fabric congestion and flow balance, and target-side threading plus media parallelism. When one layer falls behind, the system often “scales” by adding latency instead of adding useful work.
Most enterprise designs pair NVMe/TCP with Kubernetes Storage and Software-defined Block Storage so teams can grow capacity and performance without hitting array controller limits.
Designing for Linear Growth in Distributed Storage Fabrics
The best scaling outcomes come from reducing work per I/O and keeping resource ownership clear. Extra context switches, memory copies, and interrupt churn all become more expensive as you scale concurrency. User-space designs that rely on tight polling loops can reduce overhead and improve IOPS per core, especially on baremetal.
Growth also depends on consistent placement. NUMA alignment, NIC queue distribution, and CPU pinning remove a lot of jitter before you touch deeper tuning. Treat CPU cores, memory locality, and network queues as part of the storage budget, not as shared leftovers. When you plan them up front, you avoid the late-stage pattern where performance improves only by adding more nodes than the workload should need.
🚀 Scale-Out Storage Architecture for NVMe-oF Workloads
Use Simplyblock to add nodes without downtime and keep performance steady under growth.
👉 See Simplyblock Scale-Out Architecture →
NVMe-oF Scaling Characteristics Under Kubernetes Scheduling Pressure
Kubernetes Storage introduces constant change: node drains, pod restarts, and rolling upgrades. Each event can shift CPU placement and network paths, which can widen tail latency if the storage plane competes with bursty workloads.
Stable scaling in Kubernetes starts with resource guarantees for the storage services. Reserve CPU for the data path, keep those cores isolated, and align them with the right NUMA node for the NIC and NVMe devices. Next, validate lifecycle operations under load. Provisioning, attaching, mounting, and failover do not define steady-state IOPS, but they define recovery speed and operator confidence.
Topology also matters as clusters grow. Cross-rack traffic increases congestion risk, and uneven hashing can overload a single NIC queue. A storage platform that supports hyper-converged, disaggregated, and hybrid layouts gives teams room to pick the right shape per cluster and change it later without changing how applications consume volumes.
NVMe-oF Scaling Characteristics on NVMe/TCP Networks
NVMe/TCP scales well on standard Ethernet, which makes it attractive for broad deployment. CPU cost and jitter become the main trade-offs, since TCP processing consumes cycles and reacts to congestion.
You can protect scale behavior with disciplined queue and network design. RSS should spread flows across queues evenly. MTU and buffer settings must stay consistent end-to-end. NUMA placement should keep packet handling close to storage threads and memory. When these controls line up, NVMe/TCP can deliver strong throughput with stable p99 latency for many workloads.
Some teams add RDMA for a small tier with tight latency targets. That split can work, but it expands tuning work and raises the operational surface area.
Proving Scale Limits with Repeatable Benchmarks
Benchmarks should mirror production I/O. Use the same block sizes, read/write ratios, concurrency, and durability settings that your apps use. Run long enough to capture drift and tail behavior, not only warm-cache bursts.
Track three anchors that make results actionable. Start by checking p99 latency at a fixed throughput target. Next, validate throughput at a fixed p99 limit. Finally, compare CPU cost across both runs. These anchors show whether CPU, network, or media sets the ceiling.
Add stress events to the plan. Drain a node, trigger a rebuild, and rotate pods. If p99 latency spikes during these events, isolation is weak, or fairness breaks under pressure.
Changes That Improve Scale Efficiency in Real Clusters
Treat tuning as a loop: change one thing, measure, and keep what helps. Use this single checklist to guide the most common fixes:
- Pin CPU cores for the storage plane and keep them isolated from bursty workloads.
- Align NUMA placement for NIC queues, hugepages, storage threads, and NVMe devices.
- Tune queue depth and thread counts to match device parallelism without building long queues.
- Keep MTU consistent and verify RSS distribution to avoid queue hot spots.
- Enforce QoS limits so one tenant cannot inflate tail latency for everyone else.
Scale-Out Patterns and Their Trade-Offs
The table below summarizes how common deployment models tend to behave as you add nodes and workloads.
| Model | Typical Transport | Primary Strength | Common Scaling Risk |
|---|---|---|---|
| Ethernet-first expansion | NVMe/TCP | Fast rollout across many racks | CPU cost and jitter if queues drift |
| Latency tiering | NVMe/TCP + RDMA | Lower latency for select apps | More tuning work and more failure modes |
| SAN migration path | NVMe/FC + Ethernet | Familiar process for FC shops | Higher cost and fabric complexity |
Operating at Scale with simplyblock™
Simplyblock™ provides Software-defined Block Storage designed for Kubernetes Storage, with strong NVMe/TCP support and an emphasis on steady p99 behavior as clusters grow. It targets scaling issues where they start: CPU isolation for the storage plane, multi-tenant QoS to limit noisy neighbors, and clear telemetry that ties tail latency to a concrete cause.
This approach also supports flexible layouts. Teams can start hyper-converged for smaller environments, move to disaggregated storage for independent scaling, or run a hybrid model during migration. The storage service stays consistent while infrastructure changes around it.
What’s Next in High-Scale Fabric Storage Engineering
Future work will focus on CPU efficiency, deeper observability, and tighter automation. Better signals will help teams link p99 spikes to causes such as queue hot spots, congestion, and rebuild pressure. DPUs and IPUs will also matter more as enterprises push offload to free host CPU for applications and reduce jitter.
Over time, successful teams will treat the data path like a managed product: measurable, stable under churn, and resistant to config drift.
Related Terms
These pages support scale planning for NVMe/TCP, resiliency, and CPU efficiency.
Questions and Answers
NVMe-oF usually scales until one of three limits hits: target-side CPU for queue processing, initiator CPU for completions and networking, or fabric contention that inflates p99. The “surprise” is that SSD utilization can stay low while p99 spikes because queueing moves to CPU and network buffers. Validate the transport design against the NVMe over TCP architecture as concurrency increases.
As you add initiators, you increase packets-per-second and completions, which raises contention on shared queues, cores, and NIC resources. Once the target reaches a scheduling/queue saturation point, latency grows faster than throughput. This behavior is often misread as “storage got slower,” but it’s frequently a fabric + CPU scaling effect, not media.
Scaling differs mainly by how much CPU and fabric behavior you can sustain under load. TCP-based NVMe-oF tends to hit CPU ceilings sooner on small random I/O, while other transports can push that wall out if the network is engineered for it. The transport-level tradeoffs are best framed using the NVMe over Fabrics transport comparison.
Oversubscription and microburst-driven queueing are the usual killers. They don’t always show up as “bandwidth maxed,” but they do show up as rising p99 and inconsistent throughput when you add hosts. If scaling flattens while endpoints look healthy, you’re likely hitting storage network bottlenecks in distributed storage rather than an NVMe limit.
Scale one dimension at a time: add initiators, then targets, then namespaces, while holding block size and queue depth constant. Track p95/p99 plus CPU-per-IOPS at each step and repeat under background traffic, because “clean lab” results hide the real scaling cliff. If p99 jumps while throughput barely moves, you’ve found the true scaling boundary.