OLTP vs OLAP Storage IO Patterns
Terms related to simplyblock
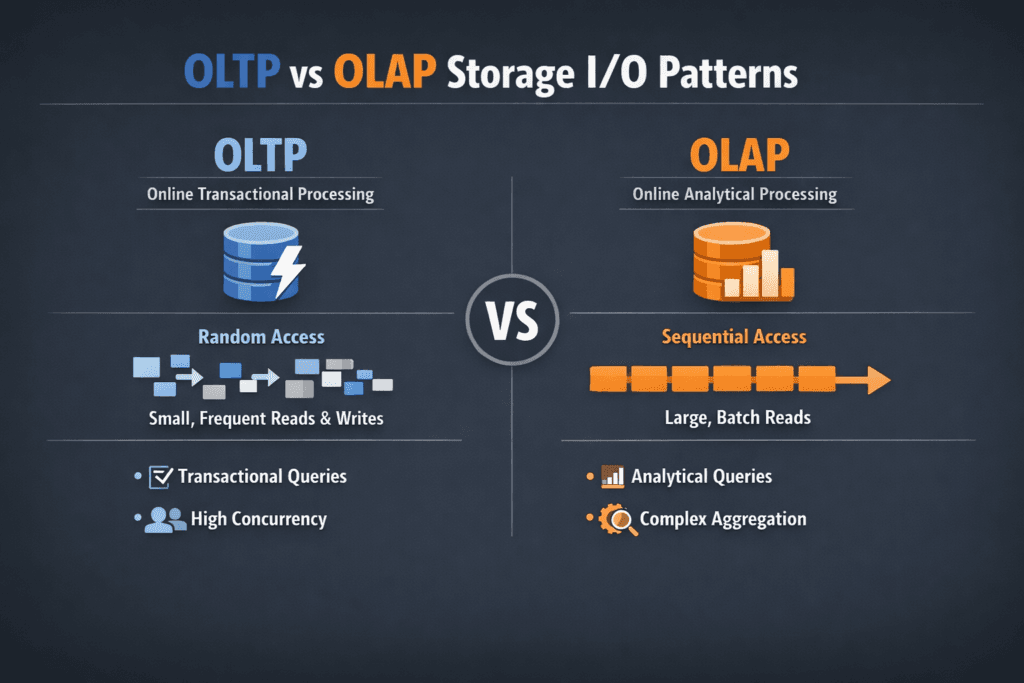
OLTP vs OLAP Storage IO Patterns describes how transactional systems and analytic systems hit storage in very different ways. OLTP focuses on many short transactions, so it drives small, random reads and writes, heavy sync behavior, and tight latency needs. OLAP focuses on analysis and reporting, so it drives long scans, larger block sizes, and high throughput needs.
Teams often ask: Why does this matter to infrastructure cost and risk? Storage design that fits OLTP keeps p99 latency low and avoids lock waits, timeouts, and retry storms. Storage design that fits OLAP keeps scans fast and avoids query pileups that burn compute. When one platform runs both, you need guardrails, or OLAP bursts will crowd out OLTP commits.
Why I/O patterns drive storage design
I/O patterns shape everything that matters in block storage: queue depth, cache hit rate, write amplification, SSD wear, and tail latency. OLTP loads punish any extra hop in the I/O path because each transaction does multiple storage actions, like log writes, index updates, and page flushes. OLAP loads punish weak bandwidth because they keep the device busy for long stretches.
A quick rule helps during planning. OLTP success depends on latency per operation. OLAP success depends on bytes per second. Good platforms still measure both because mixed workloads show up in real clusters.
🚀 Cap OLAP Bandwidth So OLTP Always Has I/O Headroom
Use Simplyblock pool and volume limits to stop long OLAP scans from consuming the NVMe/TCP I/O budget needed by transactions.
👉 Limit IOPS and Throughput →
OLTP vs OLAP Storage IO Patterns in Kubernetes Storage
Kubernetes Storage adds scheduler behavior, CSI attach and mount work, and shared-node contention. A database pod can move, but its volume still needs stable latency. If the cluster mixes tenants, a scan-heavy job can take I/O budget from a transactional service unless the storage layer enforces QoS.
Architectural choice also changes outcomes. Hyper-converged designs keep I/O close to the pod and reduce east–west traffic. Disaggregated designs scale storage and compute on their own, which helps large fleets and multi-tenant setups. Many teams mix both across node pools, especially on baremetal where they want a SAN alternative without buying an appliance.
NVMe/TCP as the fabric for mixed workloads
NVMe/TCP gives NVMe-oF access over standard Ethernet, so teams can disaggregate storage without RDMA-only networks. That flexibility matters when OLTP and OLAP share the same storage pool. You can scale throughput for analytics while keeping transactional volumes close to latency targets.
Transport choice still affects CPU cost and jitter. NVMe/TCP usually consumes more host CPU than RDMA, so the I/O path and threading model matter. When the platform keeps the data path lean and avoids extra copies, it preserves CPU for application work and reduces latency spikes during bursts.
How to measure OLTP vs OLAP Storage IO Patterns
Start with realistic profiles and repeatable runs. fio helps because it can model random OLTP traffic, as well as large OLAP scans, using job files that match block size, read/write mix, and concurrency. In Kubernetes Storage, run fio inside pods on real PVCs, not on hostPath shortcuts, and record both latency percentiles and throughput.
Use this single checklist to keep results comparable:
- Match block size and read/write mix to the workload class, then fix it for every run.
- Capture p50, p95, and p99 latency for OLTP profiles, plus IOPS, CPU, and throttling signals.
- Capture throughput, queue depth, and saturation time for OLAP profiles, plus network usage for remote storage.
- Repeat tests during a node drain or a controlled failure to see what the platform does under stress.
Tuning OLTP vs OLAP Storage IO Patterns for stable results
Protect OLTP first, then let OLAP consume what remains. Start with isolation: separate noisy analytics jobs from transactional volumes using QoS, tenant limits, and placement rules. Next, tune the I/O path: reduce copies, keep interrupts under control, and use settings that fit NVMe queue behavior.
Alignment also matters. Small OLTP writes benefit from batching and write coalescing when the platform controls it, because it reduces internal flash work. Large OLAP reads benefit from deep queues and steady prefetch, when the platform and network can sustain it.
Finally, keep measurements tied to business targets. An OLTP system needs an SLO for p99 latency and commit time. An OLAP system needs an SLO for scan time and query completion rate.
Storage workload comparison for transactional and analytical I/O
The table below summarizes how storage usually sees OLTP and OLAP traffic. Use it to pick test profiles and to set QoS boundaries in Software-defined Block Storage.
| Attribute | OLTP workload | OLAP workload |
|---|---|---|
| Typical I/O size | Small blocks (often 4K–16K) | Larger blocks (often 64K–1M) |
| Access pattern | Random, high IOPS | Sequential or mixed, high throughput |
| Latency priority | Very high (p95/p99 drives SLO) | Medium (runtime drives SLO) |
| Burst behavior | Spiky commits, fsync pressure | Long scans, sustained bandwidth |
| Risk in shared clusters | Tail latency spikes | Saturation and queue buildup |
| Storage fit | Low-latency NVMe, strong QoS | NVMe/TCP scale, high bandwidth |
Simplyblock™ for mixed database and analytics clusters
Simplyblock focuses on NVMe-first Software-defined Block Storage that fits Kubernetes Storage and NVMe/TCP deployments. Simplyblock targets a short I/O path and supports multi-tenant controls, so OLTP volumes can hold latency targets while OLAP jobs push throughput.
SPDK-based, user-space design helps reduce CPU overhead and avoid extra copies in the hot path, which supports higher IOPS per core. Simplyblock also supports flexible layouts, including hyper-converged and disaggregated node pools, so teams can place OLTP close to compute while scaling analytics throughput with remote NVMe/TCP.
Next-Generation Storage Requirements for OLTP and OLAP
Database fleets keep mixing workloads: OLTP, real-time analytics, vector search, and streaming. That mix raises the bar on isolation and observability. DPUs and IPUs will matter more as NVMe speeds rise because they can offload parts of the data path and protect the host CPU for queries.
Expect more policy-driven storage. Teams will set clear SLOs for latency and throughput, then let the platform enforce QoS and placement rules automatically, even during maintenance events.
Related Terms
Teams often review these glossary pages alongside OLTP vs OLAP Storage IO Patterns.
- Storage Metrics in Kubernetes
- IO Path Optimization
- NVMe Queue Depth Tuning
- NVMe over TCP Latency Characteristics
Questions and Answers
OLTP tends to generate small, latency-sensitive random reads and writes with high concurrency, so p99 latency and queueing dominate performance. OLAP is more scan-heavy, favoring large sequential reads and high bandwidth, with periodic large writes from ingest or compaction. Storage tuned for high-performance databases usually prioritizes predictable tail latency over peak throughput.
OLTP commits frequently and waits on durable log flushes, so even small latency spikes can throttle transactions and increase lock holds. That makes the log path—often sequential but sync-heavy—the critical bottleneck. OLAP workloads typically amortize writes in larger batches and can tolerate higher commit latency. Understanding write-ahead logging (WAL) helps explain why “fast disks” still feel slow for OLTP.
OLAP benefits most from sustained sequential bandwidth, efficient prefetch, and avoiding mid-scan throttling from background work. If your analytics stack does wide table scans, columnar reads, or large merges, you’ll see bigger gains from higher throughput per node and consistent network bandwidth than from ultra-low single-IO latency. This is the typical design target for data warehouse storage environments.
When OLTP fits in memory, storage mostly sees WAL/log writes and occasional index misses; when it spills, random reads surge, and tail latency becomes the limiter. OLAP often streams large datasets that exceed memory by design, so storage sees sustained sequential reads plus bursts from sorts, spill files, and compaction. The same hardware can “flip” from stable to unstable once cache misses push queues past the knee.
Don’t benchmark them separately and average the results. Run concurrent profiles: small-block random I/O with sync points for OLTP alongside large-block sequential reads for OLAP, then measure p95/p99 latency for OLTP while tracking bandwidth for OLAP. If OLTP p99 degrades during OLAP scans, you need stronger isolation or tiering, not just more raw throughput.