Storage Network Bottlenecks in Distributed Storage
Terms related to simplyblock
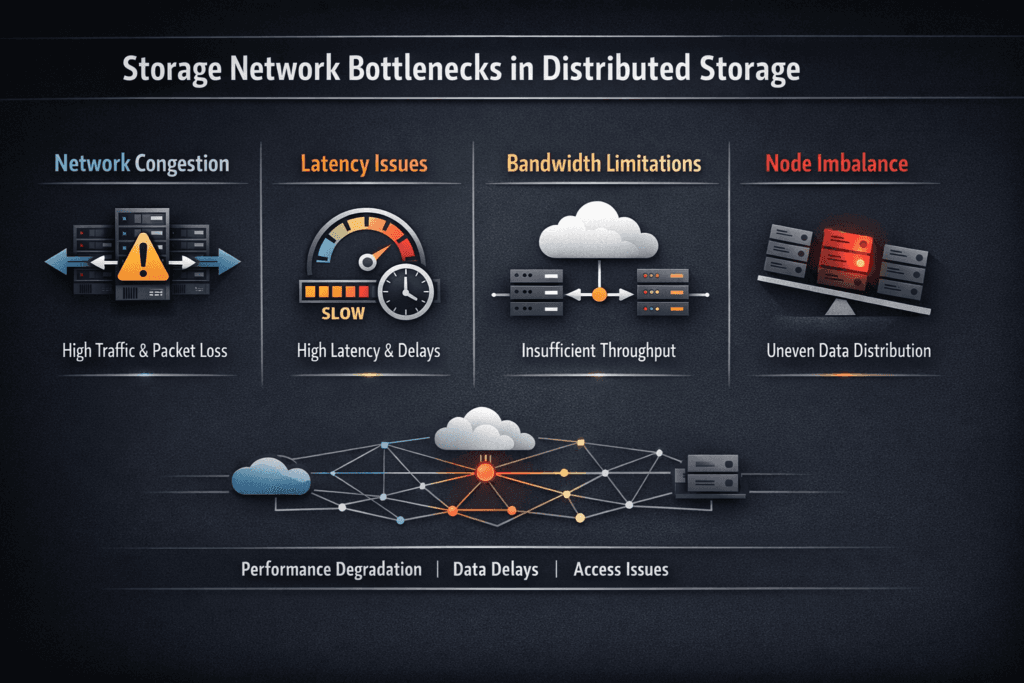
Storage Network Bottlenecks in Distributed Storage show up when the network, not the NVMe media, sets the limit for latency and throughput. In a scale-out design, each write can fan out to other nodes for replication or erasure coding, so east–west traffic grows fast.
When links run hot, or buffers drop bursts, TCP retransmits rise, queues stretch, and p99 latency climbs even though the drives still have headroom. NVMe/TCP, Kubernetes Storage, and Software-defined Block Storage all sit on top of this reality, so the network has to be treated as part of the storage data path, not a separate “infra layer.”
Where the Distributed Data Path Stalls
Most teams first blame “slow storage” when apps stall. In distributed storage, the stall often starts on the fabric. Congestion appears during reschedules, rebuilds, snapshots, backups, and compaction, when many nodes talk at once. A small amount of packet loss can create large latency spikes because TCP recovery adds delay, and the storage target sees uneven IO arrival.
This risk increases in multi-tenant Kubernetes Storage. Shared uplinks and shared ToR buffers can turn one noisy namespace into a cluster-wide tail-latency event unless the platform enforces isolation and QoS at the storage layer.
🚀 Scale Distributed Storage Without Saturating East–West Links
Use simplyblock to scale out performance and capacity while keeping latency predictable under load.
👉 Use simplyblock for Scale-Out Architecture →
Storage Network Bottlenecks in Distributed Storage Across Kubernetes Storage
Kubernetes changes traffic shape in ways that stress the fabric. Pod placement can shift hot IO sources across racks. Node drains can push recovery traffic into peak hours. Autoscaling can add bursts of new connections that compete with steady-state IO.
A distributed system also adds background network load that many teams miss during sizing. Replication traffic, metadata sync, and rebuild streams compete with foreground IO. If you run hyper-converged nodes, app traffic and storage traffic share the same NICs, so you can hit contention even when CPU and SSD metrics look fine.
For platform teams, this is where Kubernetes Storage design choices matter as much as “fast drives.” Your topology, failure domains, and traffic separation plan decide whether performance stays stable at scale.
Fabric-Aware Fixes That Work at Scale
Network bottlenecks usually respond to a few practical moves that you can standardize across clusters. Start by measuring drops and retransmits on the same timeline as p99 latency. Then reduce bursts, isolate traffic, and cap background work so it cannot starve production IO.
Use these actions as your baseline playbook (this is the only list on the page):
- Split storage traffic from general pod traffic with VLANs, dedicated NICs, or separate node pools.
- Keep MTU consistent end-to-end, and validate every hop.
- Watch microbursts and buffer drops on leaf switches, not only link utilization.
- Rate-limit rebuild and rebalancing traffic during business hours.
- Enforce per-tenant and per-volume QoS so one workload cannot flood the fabric.
- Align CPU affinity for protocol processing when hosts run hot, especially with NVMe/TCP.
Storage Network Bottlenecks in Distributed Storage When You Use NVMe/TCP
NVMe/TCP carries NVMe-oF commands over standard Ethernet and TCP, which fits most data centers and cloud VPCs without requiring an RDMA-only fabric. SNIA lists TCP as a supported NVMe-oF transport, alongside RDMA and Fibre Channel.
From a bottleneck view, NVMe/TCP shifts the tuning focus to loss, queueing, and host CPU cycles. You want clean paths with low drop rates and predictable queue depth. If the storage target runs an efficient user-space data plane, you avoid wasting CPU on the storage side, and you keep the network as the main variable to control. SPDK exists to support high-performance, user-mode storage applications, which can help reduce overhead in the hot path.
Proving the Bottleneck With Clear Benchmarks
Run tests that match real traffic and show percentile latency. Fio can model random IO, mixed read/write ratios, and queue depth, so you can measure p95 and p99 under load. Pair those runs with switch and host counters. When retransmits rise at the same time as p99 latency, the fabric is gating the storage system.
Avoid “single node, single volume” tests as your only proof. Distributed bottlenecks often appear during fan-out writes, rebuild streams, or multi-tenant spikes, so your benchmark should include concurrency across nodes and namespaces.
Network and Storage Designs Compared for Bottleneck Risk
The table below compares common deployment choices and where network bottlenecks tend to surface first in distributed storage.
| Design | Network Pattern | Common Trigger | Best Fit |
|---|---|---|---|
| Hyper-converged nodes | App + storage share NICs | NIC contention, noisy neighbors | Fast rollout, cost control |
| Disaggregated storage nodes | Storage traffic concentrates on uplinks | Uplink saturation, buffer drops | Clear fault domains, easy scaling |
| NVMe/TCP over Ethernet | Many parallel TCP flows | Loss + retransmits, CPU pressure | Broad compatibility, simple ops |
| NVMe/RDMA tier | Low-latency transport | Fabric misconfig, hardware limits | Strict latency tiers |
Storage Network Bottlenecks in Distributed Storage Under Control With Simplyblock™
Simplyblock™ is designed for predictable performance in Software-defined Block Storage, including multi-tenant Kubernetes Storage. It combines an SPDK-based data plane with controls such as multi-tenancy and QoS, so one tenant cannot distort another tenant’s latency. That isolation helps when the fabric runs hot because the platform can set boundaries instead of letting bursts spread across workloads.
Simplyblock also supports NVMe/TCP, which lets teams modernize storage networking on standard Ethernet while keeping NVMe semantics for low-latency access to pooled NVMe capacity.
What Changes Next in Storage Networking
DPUs, SmartNICs, and storage offload paths will matter more as east–west traffic keeps rising. Offload can reduce host CPU cost for protocol handling and smooth tail latency during bursts. Storage teams will also push harder on topology-aware placement and traffic class policies, so rebuild work and tenant spikes do not share the same queues as production IO.
Related Terms
These pages support troubleshooting of Storage Network Bottlenecks in Distributed Storage.
Questions and Answers
Storage network bottlenecks often result from oversubscribed links, high packet loss, or suboptimal routing between nodes. In systems using scale-out block storage over Ethernet, latency-sensitive protocols like NVMe/TCP require properly tuned NICs and reliable infrastructure.
NVMe over TCP uses standard Ethernet and supports multi-queue parallelism, enabling better I/O distribution across CPU cores and network interfaces. It helps reduce contention compared to traditional storage protocols and scales efficiently in distributed environments.
Yes. Without proper isolation, concurrent tenants may compete for bandwidth and saturate shared links. Simplyblock mitigates this by enabling multi-tenant Kubernetes storage with per-volume performance controls and built-in encryption.
Tuning parameters like MTU size, TCP window size, and CPU affinity can reduce jitter and improve IOPS. In high-performance Kubernetes workloads, this ensures smoother performance across nodes using NVMe/TCP-backed volumes.
Tools like iperf, nload, and Prometheus exporters can track bandwidth, retransmissions, and latency spikes between storage nodes. Combined with storage-layer metrics, they help pinpoint bottlenecks in distributed NVMe architectures before they impact workloads.