Storage Performance Benchmarking
Terms related to simplyblock
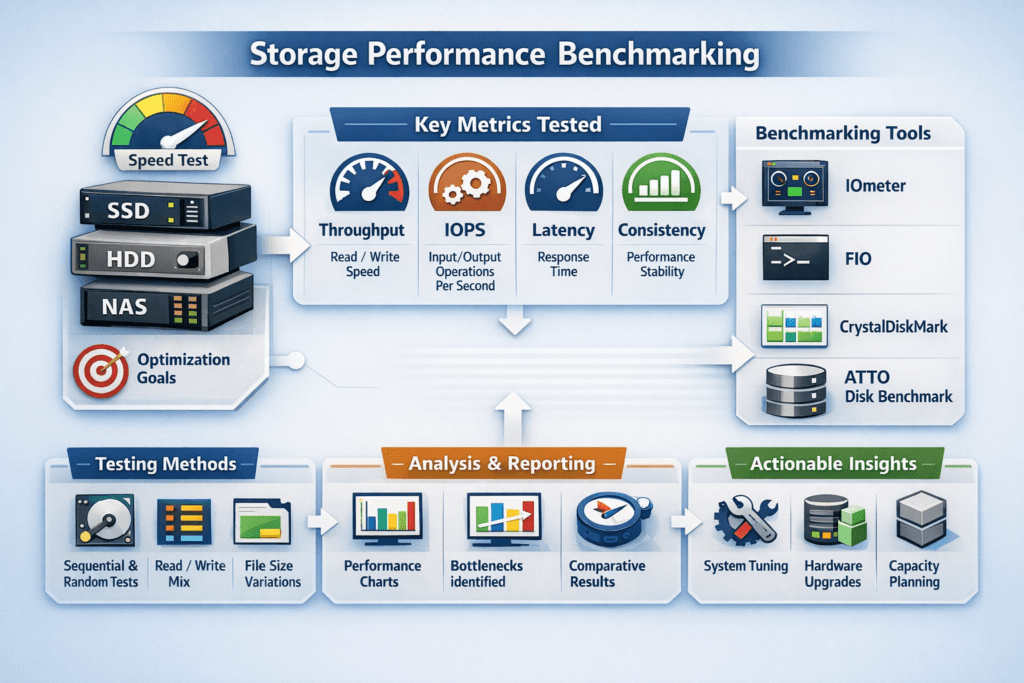
Storage Performance Benchmarking measures how a storage stack behaves under controlled load, so teams can predict application impact before production traffic hits.
The most useful benchmarks report latency (including p95 and p99), IOPS, throughput, and CPU cost across the full I/O path: application, filesystem, network, and NVMe media. A single “peak” number rarely helps. Repeatable profiles that match real block sizes, queue depth, and read/write mix help you set targets for Kubernetes Storage and Software-defined Block Storage rollouts.
Optimizing Storage Performance Benchmarking with Current Platforms
Storage Performance Benchmarking stays credible when the storage platform behaves consistently under load, not only in a clean lab run. Software-defined Block Storage improves repeatability through per-volume QoS, isolation between tenants, and controlled background activity (rebuild, rebalance, snapshots). When background work competes with foreground I/O, averages can look fine while p99 drifts, which is where user-facing slowdowns appear.
I/O path efficiency matters too. A shorter datapath reduces CPU overhead per I/O and lowers jitter, which makes benchmark results more stable as concurrency increases.
🚀 Run Storage Performance Benchmarking on NVMe/TCP, Natively in Kubernetes
Use simplyblock to standardize test methodology, tighten p99 latency, and keep results repeatable across clusters.
👉 Get the Simplyblock Performance Benchmark →
Storage Performance Benchmarking in Kubernetes Storage
Kubernetes Storage adds variables that can invalidate “outside the cluster” benchmarks: cgroup limits, CPU throttling, NUMA layout, pod scheduling, and the CSI path. Running benchmarks as pods, pinned to specific nodes, usually produces results that match production behavior more closely than host-only tests.
Multi-team clusters also change how you interpret results. Two namespaces can share the same backend and still see different tail latency because of competing workloads, node placement, and network contention. This is where Software-defined Block Storage controls, such as QoS and tenancy isolation, turn raw performance into predictable service levels.
Storage Performance Benchmarking and NVMe/TCP
NVMe/TCP is a practical baseline for disaggregated storage benchmarks because it runs on standard Ethernet while keeping NVMe semantics end to end. It also fits Kubernetes Storage well because it scales across nodes without requiring RDMA fabric tuning to get started.
When you benchmark NVMe/TCP, measure initiator and target CPU use alongside latency and throughput. CPU headroom often becomes the limiting factor before NVMe media saturates, and you usually see that first as rising p99 at higher queue depth.
How to Measure Storage Performance in Practice
A benchmark plan should answer three questions: what workload matters, what target must be hit, and what regression blocks rollout. Treat it like a test suite with fixed profiles, fixed reporting, and repeatable runs.
- Define 3–5 profiles that mirror production I/O (for example, 4K random read, 4K 70/30 mixed, and 128K sequential), and keep them versioned.
- Run each profile at multiple queue depths to find where latency bends upward, not just where throughput peaks.
- Report p95 and p99 latency with IOPS and throughput, then track CPU and network metrics in the same time window.
- Re-run the suite after CSI, kernel, topology, or policy changes, and compare deltas instead of single-run highs.
Tools like fio work well for this because they model block sizes, job count, queue depth, and latency distributions that align with SLO discussions.
Ways to Improve Benchmark Results Without Gaming the Test
Start by reducing variance, then raise the peak. Keep pods close to data when possible, avoid surprise background jobs during test windows, and cap noisy-neighbor impact with per-volume QoS. If results fluctuate, inspect the CPU and interrupt path. IRQ pressure and poor CPU sizing can add jitter even when the media has headroom.
User-space datapaths based on SPDK principles reduce context switching and interrupt overhead, which helps keep tail latency stable under bursty load. That stability matters more than a brief maximum if the target is predictable performance for business-critical services.
Benchmarking Method Comparison for Cloud-Native Storage
The table below summarizes common approaches and what they reveal in Kubernetes Storage and Software-defined Block Storage environments.
| Approach | What it measures well | What it misses | Best use case |
|---|---|---|---|
| Synthetic microbench (fio in pods) | Latency distribution, IOPS ceilings, throughput under fixed profiles | Full app behavior and caching | Capacity planning and regression tests |
| App-level test (real DB or pipeline) | End-to-end impact and real flush patterns | Harder to reproduce, slower to iterate | Validating SLOs for top workloads |
| Canary + telemetry | Real variance, scheduling effects, noisy neighbors | Requires solid observability | Change control and upgrade confidence |
Performance Isolation for Multi-Team Kubernetes Platforms
Simplyblock targets predictable performance for Kubernetes Storage by pairing NVMe/TCP with Software-defined Block Storage controls such as multi-tenancy and QoS. That matters when different teams share clusters and still need consistent tail latency during spikes.
Simplyblock also benefits from SPDK-style user-space, zero-copy design choices that reduce datapath overhead, which can translate into more stable p99 at higher concurrency. With flexible deployment modes (hyper-converged, disaggregated, or hybrid), teams can benchmark the same topology they plan to operate, then enforce the same policies in production.
Future Improvements in Observability and Workload Replay
Benchmarking is shifting toward continuous validation. Short canary runs inside the cluster, scored against p99 targets, can flag regressions during releases instead of after incidents. Workload replay also improves realism by reproducing real I/O mix and burst patterns, which helps explain why a synthetic peak sometimes fails to match production behavior.
Expect more focus on correlating storage metrics with application symptoms, plus more automation that turns telemetry into policy changes, such as smarter QoS guardrails and safer background-work scheduling.
Related Terms
Teams pair these with Storage Performance Benchmarking to validate latency, IOPS, and repeatability in Kubernetes Storage.
Questions and Answers
In enterprise setups, benchmarking storage performance requires simulating production-like workloads using tools such as FIO. Key metrics include latency, IOPS, throughput, and protocol overhead. These help assess technologies like NVMe over TCP versus iSCSI under realistic load conditions, ensuring optimal performance for databases, VMs, and Kubernetes environments.
The most important metrics are IOPS for operations per second, latency for response times, throughput for data transfer rates, and protocol overhead. These define how well a storage system handles real workloads. For instance, NVMe/TCP shows significant gains across all four metrics compared to legacy protocols like iSCSI.
In head-to-head benchmarks, NVMe over TCP outperforms iSCSI by delivering up to 35% higher IOPS, 25% lower latency, and 20% more throughput on identical hardware. This makes NVMe/TCP the preferred choice for high-performance use cases like analytics, virtualization, and Kubernetes storage.
FIO (Flexible I/O Tester) is one of the most widely used tools for benchmarking. It can simulate various workloads, queue depths, and block sizes. FIO is crucial for testing performance on protocols like NVMe/TCP and helps validate real-world behavior in both bare-metal and cloud-native environments.
Block size and queue depth significantly affect benchmarking results. Smaller blocks typically increase IOPS, while larger blocks improve throughput. A higher queue depth can fully saturate modern storage systems like NVMe/TCP. Tuning both parameters is essential when comparing against older protocols such as iSCSI.