Synthetic vs Application Storage Benchmarks
Terms related to simplyblock
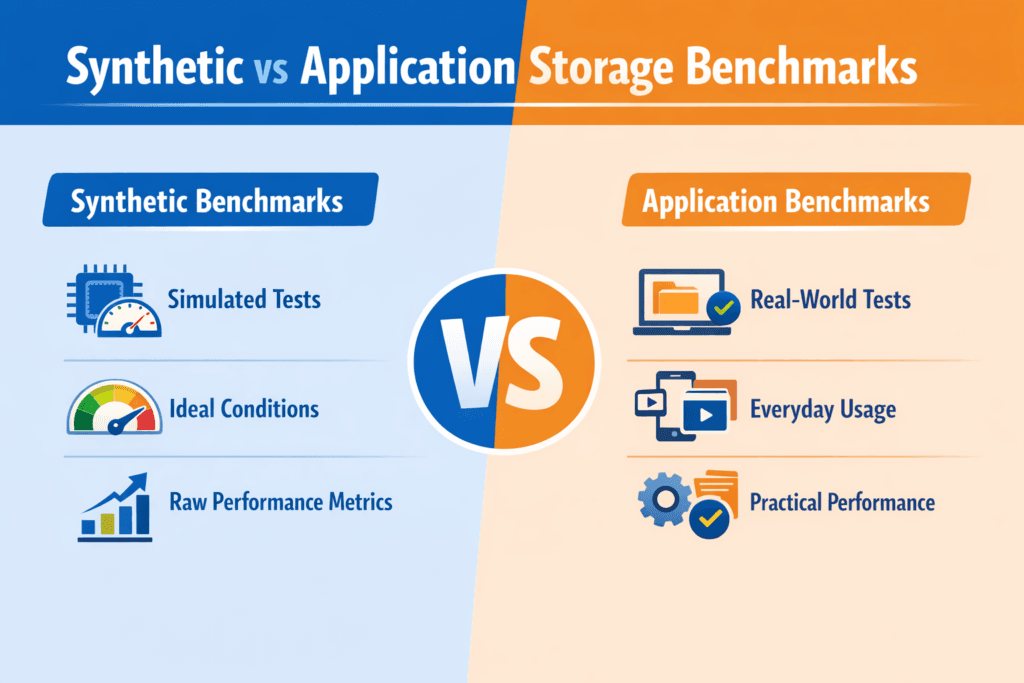
Synthetic vs Application Storage Benchmarks compares two ways to test storage. Synthetic benchmarks generate controlled I/O patterns (like 4K random reads at fixed queue depth). Application benchmarks run a real workload path (like a database, search index, or log pipeline) and measure user-facing impact.
Synthetic tests help you isolate a single layer. They answer questions like, “Does this NVMe pool hit the IOPS target?” or “Does NVMe/TCP add CPU overhead at higher concurrency?” Application tests validate the full stack, including the filesystem, the client libraries, the scheduler, and the storage backend.
Both methods matter in Kubernetes Storage. You often tune primitives with synthetic runs, then confirm the business result with an application run. Software-defined Block Storage adds more knobs, too, such as replication, erasure coding, caching, and QoS, so the benchmark type you pick changes what you learn.
Optimizing benchmark choice with practical tooling
Pick the benchmark based on the decision you need to make. Use synthetic testing when you need clean, repeatable data for procurement, capacity planning, or transport tuning. Switch to application testing when you want to validate release risk, tail latency, and tenant interference.
A strong workflow uses the same discipline every time. Define the goal first, then choose the tool, the test profile, and the success metric. Most teams also run tests on baremetal and in-cluster, because Kubernetes overhead can change CPU and network pressure.
When you compare results, keep one rule in mind: synthetic numbers show headroom, while application numbers show outcomes. Treat them as different inputs, not competing “truth.”
🚀 Benchmark Real Database I/O Paths in Kubernetes
Use Simplyblock to reduce storage jitter that skews application benchmark results under load.
👉 Use Simplyblock for Databases on Kubernetes →
Synthetic vs Application Storage Benchmarks in Kubernetes Storage
Kubernetes Storage changes benchmark meaning because the benchmark hits a Persistent Volume path, not a single device. CSI, kubelet behavior, node scheduling, and network routing all shape the result.
Synthetic testing in Kubernetes often runs in a pod with a PVC and a strict CPU limit. That setup helps you see what the platform delivers under guardrails. Application testing usually runs the full app chart, the same resource requests, and the same storage class you run in production. That approach surfaces real bottlenecks like compaction bursts, log flush cadence, and checkpoint storms.
Architecture matters as well. Hyper-converged storage can reduce hops, while disaggregated storage can improve isolation. Run both benchmark types when you evaluate that trade. Synthetic runs tell you how the storage layer scales. Application runs tell you how the app behaves when the cluster gets busy.
Synthetic vs Application Storage Benchmarks and NVMe/TCP
NVMe/TCP brings strong performance on standard Ethernet, but it also adds transport CPU cost and network queueing. Synthetic tests can isolate those effects by sweeping queue depth, block size, and job count until you find the knee in the curve.
Application tests expose a different risk: jitter. Many apps care less about peak IOPS and more about p99 latency under mixed load. NVMe/TCP can still meet those targets, but the stack must keep CPU headroom, avoid packet loss, and enforce fair-share behavior across tenants.
If you run Software-defined Block Storage over NVMe/TCP, validate both layers. First, confirm the transport ceiling with a synthetic test. Next, confirm that the app meets its SLO during real concurrency, failover, and background tasks like snapshots.
Measuring and Benchmarking Synthetic vs Application Storage Benchmarks Performance
The best reports answer simple questions that execs and operators both care about: “What throughput do we get at the latency target,” “How much headroom remains,” and “How does multi-tenant load change the outcome?”
Use the same metric set across both benchmark types so you can compare them without guesswork. That usually means IOPS, bandwidth, p95 and p99 latency, CPU per I/O, and error rate. For Kubernetes Storage, also track node IRQ load, network drops, and throttling events.
Use this single checklist to keep runs comparable:
- Define a single workload goal per run, then lock the I/O profile and runtime.
- Capture p50, p95, and p99 latency, plus IOPS stability over time.
- Pin CPU and NUMA placement, and keep background jobs off the test nodes.
- Match the StorageClass settings to production, including protection and QoS.
- Repeat each run, and report variance, not just the best score.
Approaches for improving benchmark fidelity and repeatability
Benchmark drift often comes from the layers you forgot to measure. Start with the data path and remove avoidable overhead. SPDK-based designs can reduce context switches and copies because they run a user-space, zero-copy I/O path. That matters when you test NVMe-oF transports and want more CPU for the workload, not for kernel work.
Next, control contention. Multi-tenancy and QoS prevent a “loud” job from pushing other workloads into tail-latency spikes. That control helps both synthetic and application testing, because it keeps the environment stable across runs.
Finally, align the benchmark to the app’s real I/O shape. If the app writes a WAL and then fsyncs, test that. If the app runs mixed reads and writes with bursts, mirror that pattern. A close match cuts false confidence.
Latency and throughput tradeoffs across benchmark types
The table below summarizes what each benchmark type can and cannot tell you when you run Kubernetes Storage on NVMe/TCP with Software-defined Block Storage.
| Area you measure | Synthetic benchmark strength | Application benchmark strength | Common mistake |
|---|---|---|---|
| Peak IOPS and bandwidth | Shows ceiling fast | Often hides the ceiling behind the app logic | Treating peak as a user metric |
| Tail latency (p99) | Shows transport and stack jitter | Shows user impact and SLO risk | Reporting only averages |
| Multi-tenant interference | Shows pool fairness and QoS impact | Shows real blast radius | Testing on an empty cluster only |
| Failover and recovery | Limited unless you script faults | Shows app behavior during events | Ignoring rebuild and resync time |
| Capacity planning | Great for baselines and trends | Great for app-specific growth | Mixing profiles and comparing anyway |
Simplyblock™ support for repeatable storage validation
With simplyblock, teams can run Software-defined Block Storage on NVMe/TCP and keep the NVMe command path end to end. The platform uses an SPDK-based, user-space architecture and targets efficient CPU use, which helps when synthetic runs push high queue depth and when application runs stress p99.
Simplyblock also supports Kubernetes Storage in hyper-converged, disaggregated, and hybrid layouts. That flexibility helps you compare architectures without swapping storage stacks. Multi-tenancy and QoS add a clean way to set guardrails, so one test run does not distort another team’s results.
Future directions and advancements in storage benchmarking
Benchmark practice keeps moving toward automation and policy. Teams increasingly define a latency target, then tune concurrency and QoS to hit it under load. Tooling also shifts toward “benchmark plus observability,” where you correlate results with CPU, network, and storage internals in one view.
Hardware offload will matter more, too. DPUs and IPUs can handle parts of the storage and network path, which reduces jitter and CPU burn. As those designs spread, synthetic tests will better reflect production behavior, and application tests will see fewer “mystery” latency spikes.
Related Terms
Teams often review these glossary pages alongside Synthetic vs Application Storage Benchmarks.
Dynamic Provisioning in Kubernetes
Snapshot vs Clone in Storage
Object Storage vs Block Storage
Hyper-Converged Storage
Questions and Answers
Synthetic benchmarks isolate specific I/O patterns (random/seq, block size, queue depth) to measure raw capability and saturation points. Application benchmarks replay real database, VM, or analytics behavior and capture how caching, journaling, and sync writes affect tail latency. Synthetic is best for controlled comparisons; application tests are best for predicting real SLAs. Use both to avoid optimizing for a pattern you’ll never run.
Synthetic tests can use idealized patterns, warm caches, and steady concurrency that apps rarely sustain, so they inflate throughput and hide p99 latency spikes. They also tend to underrepresent metadata, compaction, background rebuild, and mixed read/write behavior that real systems trigger. If a platform looks “fast” synthetically but slow in production, the gap is usually tail latency under contention, not missing bandwidth.
Use synthetic tools when you need fast, repeatable baselines, or when you’re validating a storage change (new nodes, new network, new StorageClass) and want clear A/B results. The Fio storage benchmark is strong for precise block I/O modeling; elbencho is strong for distributed load and shared filesystem stress. Then confirm with at least one application test that matches your production write sync and concurrency.
They can be hard to reproduce and easy to misinterpret because results depend on schema, cache state, compaction, checkpoint timing, and client behavior. A single run can be dominated by background events rather than storage capability, making vendor comparisons messy. The fix is to pair app tests with a stable synthetic baseline and report p95/p99 latency, not just “transactions per second.” See p99 storage latency for the metric that usually exposes the truth.
Start with a synthetic to map the safe operating envelope (latency knee, max sustainable throughput) and validate configuration consistency across environments. Then run an application benchmark that mirrors your real read/write mix, sync settings, and working set, and confirm it stays inside that envelope. If the app violates it, tune workload concurrency or storage policy until p99 stabilizes. A methodical approach, like storage performance benchmarking, keeps results comparable across clusters.