p99 storage latency
Terms related to simplyblock
p99 storage latency shows how slow the “worst regular” storage requests run. It reports the 99th percentile response time for reads and writes. In plain terms, 99 out of 100 I/O requests finish at or below that number, and 1 out of 100 takes longer. That small slice often drives user-visible stalls, database timeouts, and retry bursts.
Average latency can look healthy while p99 climbs. Apps feel the tail first because queues build behind slow requests. When a queue grows, even fast I/O starts waiting.
Optimizing p99 storage latency with modern control planes
Teams control p99 when they manage contention, placement, and background work. They also keep the I/O path short. In Kubernetes Storage, several layers compete for the same CPU, network, and disks, so p99 often jumps during resync, snapshots, autoscaling, and node churn.
A strong platform treats latency like a contract. It sets per-volume targets, enforces fairness across tenants, and limits background traffic before it hurts foreground I/O. Software-defined Block Storage helps because it lets you apply those rules in software, across baremetal clusters, cloud nodes, and mixed pools, without changing the application.
🚀 Benchmark p99 Storage Latency on NVMe/TCP in Kubernetes
Use Simplyblock to validate tail latency, enforce QoS, and remove noisy-neighbor jitter at scale.
👉 See the Simplyblock Performance Benchmark →
p99 storage latency in Kubernetes Storage
Kubernetes Storage adds scheduling and orchestration effects that can turn small hiccups into long tails. Pod placement matters as much as device speed. A stateful workload that lands on a busy node can inherit higher p99 at once, even when the backend array looks fine.
CSI behavior also shapes tail results. Attach, mount, and path changes can spike latency during rollouts. Multi-tenancy raises the stakes because one noisy namespace can push everyone’s p99 up when the platform lacks isolation. Teams that standardize StorageClasses, topology rules, and per-tenant limits see fewer surprises in production.
p99 storage latency and NVMe/TCP
NVMe/TCP carries NVMe-oF commands over standard Ethernet. It can reduce protocol overhead compared to older network storage approaches, especially when the stack avoids extra copies and excess context switches. NVMe/TCP still needs headroom. If the node runs hot on the CPU, p99 often rises, even with fast media.
The best results come from matching the protocol to a disciplined data path and clear QoS rules. When you combine NVMe/TCP with Software-defined Block Storage, you can keep performance consistent across clusters while still using commodity networking. For executive stakeholders, that consistency matters more than a single best-case benchmark run.
Measuring and benchmarking tail latency for storage
Measure p99 where the business feels it, and where operators can act on it. Application-side SLIs tell you when users suffer. Storage-side histograms tell you why.
Use test patterns that match production. Random reads at small block sizes stress different parts of the stack than large sequential writes. Queue depth changes the story again. Run the same test on each node pool, then repeat under controlled contention. That method shows how fast p99 degrades when neighbors compete for the same resources.
Track at least four signals: p50, p95, p99, and error or retry rate. Add CPU per I/O as a final check. High throughput with high CPU cost often breaks density goals during peak traffic.
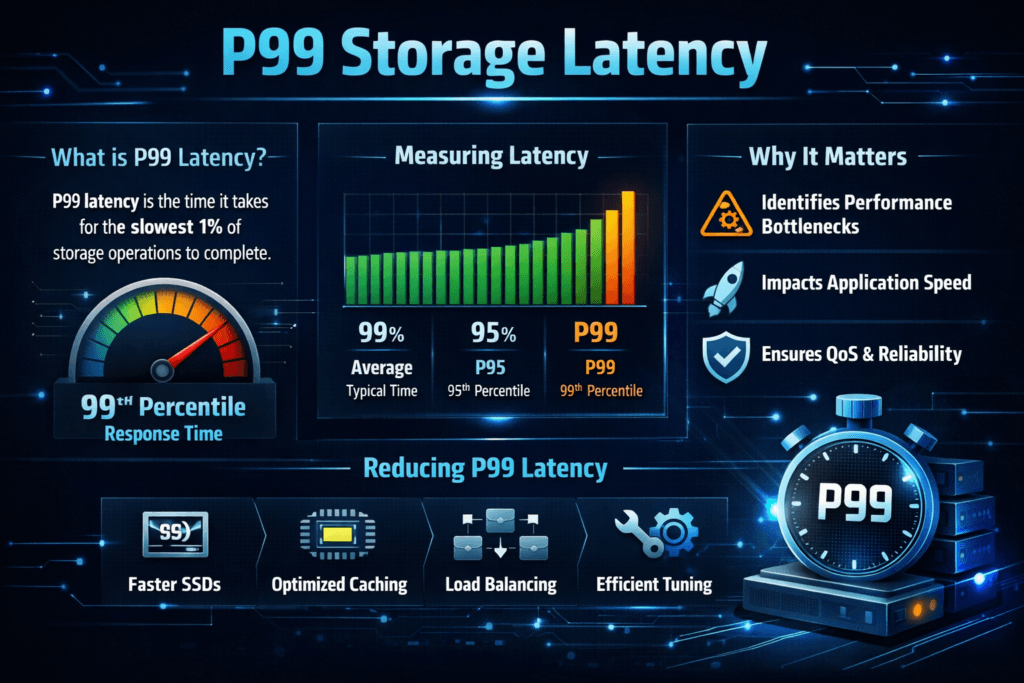
Practical ways to reduce tail spikes
- Set explicit p99 targets in your SLOs, and review them per workload tier.
- Enforce per-volume and per-tenant QoS so one noisy service cannot crowd out critical databases.
- Separate background jobs, rebuild traffic, and snapshots from latency-sensitive volumes whenever possible.
- Keep node pools consistent for stateful workloads, and avoid mixing “fast” and “slow” hardware in the same tier.
- Validate changes with the same percentile view every time, including during rollouts and failure drills.
Percentiles vs averages – what each metric tells you
The table below helps teams choose the right metric for each conversation. It also explains why “good averages” can still produce slow user requests.
| Metric | What it shows | What it’s good for | Where it fails |
|---|---|---|---|
| Average latency | Mean response time | Trend tracking over time | Hides spikes |
| p50 (median) | Typical request | Day-to-day baseline | Misses tail risk |
| p95 | Early tail signal | Catching rising contention | Needs a solid sample size |
| p99 | Tail behavior | SLO enforcement, timeouts | Needs solid sample size |
| Max | Worst observed | Incident review | Too noisy for planning |
Consistent tail latency controls with Simplyblock™
Simplyblock™ focuses on stable performance for Kubernetes Storage by combining a tight data path with policy controls. Simplyblock delivers Software-defined Block Storage designed for NVMe-oF use cases, including NVMe/TCP, and it targets steady behavior under mixed workload pressure.
SPDK-based, user-space I/O helps reduce wasted CPU cycles and extra copies in the hot path. That design supports lower jitter when the cluster runs busy. Multi-tenancy and QoS controls also matter because they keep neighbors from stealing latency budget during bursts. With the right policies, teams can hold p99 inside an SLO even during resync and rolling updates.
Future directions in tail-focused storage engineering
Tail metrics keep moving closer to the center of platform engineering. More teams now treat p99 as a first-class release gate for storage changes, not a “post-incident” chart. Better histograms, better tracing, and clearer correlation across node, network, and volume layers will keep pushing that trend.
Hardware offload also plays a role. DPUs and IPUs can shift parts of the data path off the host CPU, which can cut jitter during busy periods. As these patterns spread, operators will rely less on manual tuning and more on policy-based control that keeps tail behavior steady by default.
Related Terms
Teams often review these glossary pages alongside p99 storage latency when they set targets for Kubernetes Storage and Software-defined Block Storage.
Storage Latency
Network Storage Performance
Storage Rebalancing
I/O Path Optimization
Questions and Answers
p99 storage latency reflects the worst-case delays in 1% of storage operations, highlighting outlier behavior. This is key in high-performance environments like real-time analytics or latency-sensitive applications, where occasional slowdowns can break SLAs or user expectations.
p99 latency reveals hidden performance degradation that average latency overlooks. Especially in distributed storage systems, even rare slow operations can impact databases, microservices, and user-facing applications.
NVMe over TCP significantly lowers p99 latency compared to iSCSI by reducing protocol overhead. Benchmarks show up to 25% improvements under load, making it ideal for Kubernetes, VMs, and latency-sensitive systems.
Reducing p99 latency in Kubernetes requires using a CSI driver that supports high-performance storage. Simplyblock’s CSI integration with NVMe/TCP and encryption allows dynamic provisioning with consistent low-latency performance.
p99 latency is impacted by protocol efficiency, network stack, I/O queue depth, and storage media. Using NVMe storage over traditional spinning disks or older protocols like iSCSI drastically reduces tail latency and boosts workload predictability.