Ceph Control Plane
Terms related to simplyblock
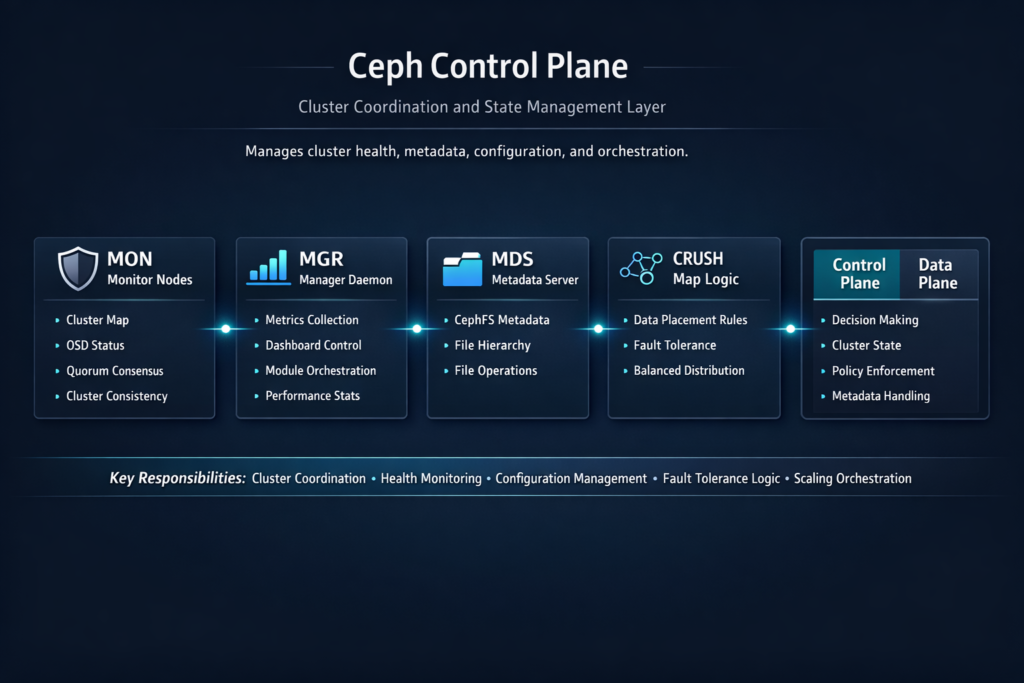
The Ceph Control Plane runs the management side of a Ceph cluster. It tracks cluster health, maintains maps, coordinates placement decisions, and drives actions like recovery and rebalancing. When this layer slows down, teams see longer rollouts, slower restore times, and more operational load, even if raw I/O looks strong.
This comparison focuses on how Ceph’s management workflows stack up against block-first platforms designed around Kubernetes Storage operations, NVMe/TCP rollouts, and Software-defined Block Storage lifecycle speed.
How Cluster Decisions Flow from Health Checks to Placement
Ceph relies on constant signals from the cluster to keep maps current and to keep services aligned. Monitors track quorum and publish maps. Managers surface telemetry and orchestration signals. OSD services report health and run data placement work. Each part plays a role in stability, but each part also adds moving pieces that ops teams must manage.
Fast storage media does not fix slow decision loops. If the cluster takes too long to react to change, you can still miss SLOs during failures, upgrades, and maintenance. Strong outcomes come from a control layer that stays responsive under churn.
🚀 Replace Ceph Control Plane Complexity with a Kubernetes-First Storage Model
Use Simplyblock to simplify lifecycle automation while keeping NVMe/TCP block performance steady.
👉 Use a Ceph Storage Alternative →
Ceph Control Plane Fit for Kubernetes Storage Operations
Kubernetes raises the bar for day-two operations. Pods move. Nodes drain. Upgrades happen on a schedule. Volume lifecycle steps must stay reliable while the platform changes underneath.
The Ceph Control Plane affects how quickly teams can provision, attach, expand, snapshot, and restore volumes. It also shapes how smooth node maintenance feels for stateful apps. When the management layer lags, storage becomes the blocker for platform delivery.
Block-first Software-defined Block Storage platforms often narrow the scope to volume lifecycle and policy enforcement. That focus can reduce “surprise” work during routine operations, especially in shared clusters with many tenants.
Ceph Control Plane Impact on NVMe/TCP Deployments
NVMe/TCP can simplify high-performance networking by using standard Ethernet. That simplifies rollout, but it also makes software overhead and operational flow more visible. Teams still need fast and reliable control actions: clean provisioning, safe upgrades, and quick recovery handling.
Ceph can benefit from NVMe media and stronger networking, yet the control layer still governs how the cluster reacts to change. If recovery and rebalancing tie up the management workflow, application teams feel it as jitter and rollout delays. A block-first platform that keeps lifecycle steps tight can reduce this friction, especially when the organization scales clusters quickly.
How to Measure Control-Plane Health in Real Environments
IOPS numbers do not describe control-plane quality. Time-based metrics do. Track how long core actions take and how often they fail or need retries. Tie those results to platform outcomes so leadership can compare options with the same scorecard.
Use repeatable tests that match production events, such as rolling node drains, scale-outs, disk replacements, and failure injection. Measure behavior during normal hours, not only in quiet windows.
- Time to provision and make a volume ready for use
- Attach time after pod scheduling and reschedule events
- Time to return to a steady state after a node or disk failure
- Time to complete maintenance actions for stateful sets
Tuning Levers That Reduce Toil and Speed Up Change
Teams usually improve Ceph operations by reducing drift and limiting “special case” behavior. Standard hardware, clean network layout, and clear failure domains all help. Recovery controls matter too, because rebuild work can compete with daily operations.
Block-first platforms often simplify this picture by mapping policies to outcomes with fewer cluster-wide knobs. That can reduce manual steps and cut down on troubleshooting time.
How Each Approach Handles Churn, Recovery, and Scale
The table below focuses on operational speed, risk under churn, and how well each approach fits Kubernetes Storage and NVMe/TCP rollouts.
| Decision area | Ceph (broad distributed platform) | Block-first Software-defined Block Storage (example: simplyblock) |
|---|---|---|
| What it optimizes | Many storage services in one stack | Block volume lifecycle and policy control |
| Ops profile | More tuning surface area | Smaller operational surface area |
| Kubernetes lifecycle | Depends on strong ops discipline | Often designed around CSI lifecycle speed |
| Multi-tenant behavior | Possible with careful design | Commonly built in with QoS |
| Change handling | Can slow during heavy recovery | Often keeps lifecycle actions more direct |
Ceph Control Plane Stability with simplyblock™
Simplyblock™ targets Kubernetes-first storage operations with a block-first approach. It focuses on fast, repeatable lifecycle actions while keeping isolation controls clear for shared clusters. It also supports NVMe/TCP and delivers Software-defined Block Storage that fits hyper-converged, disaggregated, or mixed deployments.
For teams that compare control-plane burden, simplyblock™ emphasizes multi-tenancy, QoS, and operational clarity. That helps platform owners keep storage reliable without adding a long list of day-two tasks.
Where Control Planes Are Headed Next
Control planes across the industry will move toward stronger automation, safer upgrades under load, and better awareness of topology and failure domains. Kubernetes will keep pushing for faster, safer lifecycle steps. Storage platforms that separate management work from the hot path and that enforce isolation by default will match that direction well.
Ceph will keep improving as a broad platform. Block-first systems will keep tightening lifecycle flow and performance isolation. Teams should pick the approach that meets SLOs with the least operational friction.
Related Terms
Teams review these pages when they assess day-two storage operations and lifecycle speed.
Storage Control Plane
CSI Control Plane vs Data Plane
Operational Overhead of Distributed Storage
Ceph Replacement Architecture
Questions and Answers
Ceph control plane health is dominated by MON quorum, manager services, and metadata coordination, because they decide cluster membership, maps, and safe state transitions. If the quorum is unstable, data may still exist, but clients can stall on map updates and timeouts. That’s why separating control and I/O thinking using storage control plane and control plane vs data plane in storage prevents “fast disks, slow cluster” surprises.
When quorum membership flaps, Ceph can thrash on elections and map propagation, inflating client latencies and delaying recovery decisions. This shows up as intermittent hangs even if OSDs and NVMe look fine. The practical fix is treating quorum placement as a fault-domain problem, not a VM-placement detail, using concepts like fault tolerance and real failure boundaries.
As cluster size grows, control plane work increases: more map updates, more events, more orchestration, more background coordination. Provisioning, peering decisions, and operational workflows can slow down while raw throughput still has headroom. This is the classic symptom of a stressed storage control plane and is why you should monitor control-plane latency separately from IOPS/GBps.
During rollouts, node drains, and reschedules, CSI increases control-plane calls (publish/unpublish, map updates, retries) and can amplify MON/MGR load under failure. If the control plane is already near its limit, you’ll see attach/mount delays and readiness stalls rather than clean I/O errors. Debug by separating hot-path I/O from orchestration using the CSI control plane vs the data plane and watching the CSI performance overhead.
Look for rising map update latency, quorum instability, slow ops that correlate with management actions, and increased retry rates during lifecycle events. Applications typically feel this as p99 spikes and “random” timeouts rather than steady throughput loss. Pair Ceph signals with platform-level storage metrics in Kubernetes so you can distinguish control-plane backpressure from pure data-plane saturation.