Kubernetes Volume Health Monitoring
Terms related to simplyblock
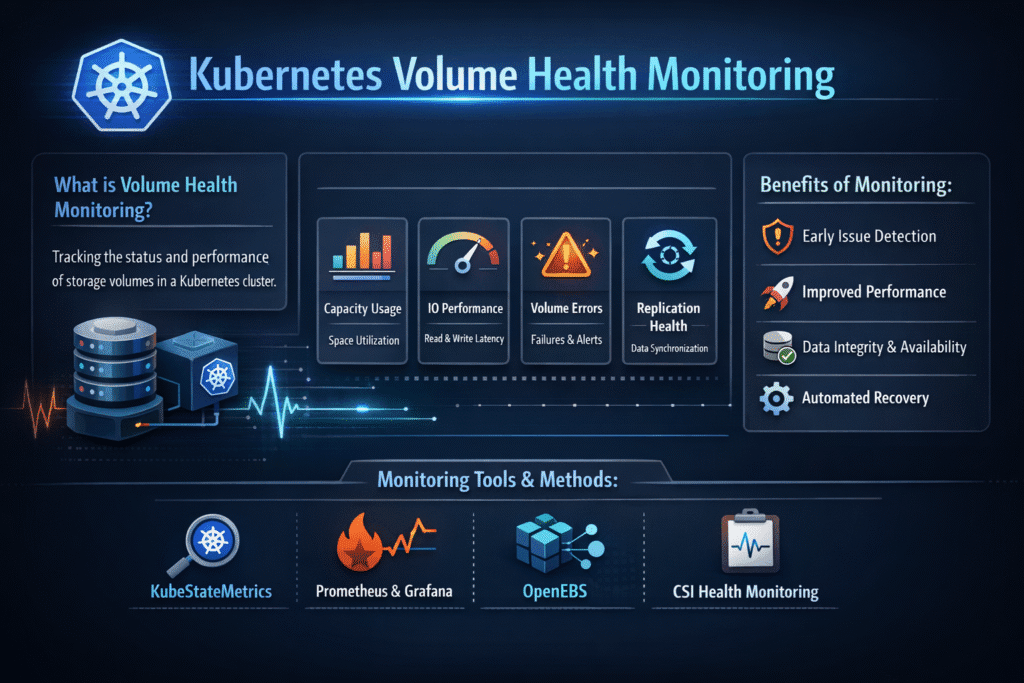
Kubernetes Volume Health Monitoring helps teams detect when a volume starts to drift from “healthy” behavior, such as rising I/O errors, repeated timeouts, slow paths, or backend alerts that predict failure. In practical terms, it turns storage problems into signals you can route to on-call, dashboards, and policy, before apps crash or data paths stall.
Leaders care because storage health issues hit revenue fast. Operators care because volume symptoms often look like app bugs at first. A clear health model shortens triage and helps teams avoid “restart and hope” as a standard fix.
Defining “Healthy” Volumes With Checks You Can Act On
A useful health model ties every signal to the next step. Start with what your teams can do quickly during an incident, then expand.
A “healthy” volume usually shows steady latency, low error rates, stable mount behavior, and clean attach and detach flows. A “degrading” volume often shows tail latency spikes, queue buildup, and retries, even when average latency looks fine. A “failed” volume shows hard errors, repeated mount failures, or stalled I/O that blocks pods from starting.
Good health monitoring also respects workload shape. A database volume needs strict tail latency targets. A batch scratch volume can tolerate spikes if it still finishes on time.
🚀 Catch Volume Issues Early in Kubernetes
Use Simplyblock to monitor volume health signals and enforce QoS on NVMe/TCP-backed Kubernetes Storage.
👉 See Simplyblock for Kubernetes Storage →
Kubernetes Volume Health Monitoring Signals Inside Kubernetes Storage
Kubernetes Storage exposes volume health through a mix of events, CSI-sidecar logs, node signals, and backend storage telemetry. Teams get the best results when they connect these sources into one story.
Start at the Kubernetes layer and track PVC and Pod events tied to attach, mount, and publish steps. Add CSI driver logs that show timing, error codes, and retries. Then pull node metrics that reflect CPU pressure, memory stalls, and network jitter that can distort I/O. Finally, add backend volume status, pool health, and device warnings.
This approach prevents false blame. A pod can fail on the mount because the node runs out of resources. A volume can look “slow” because the network path drops packets. Strong monitoring separates the layers, then correlates them.
NVMe/TCP Health Paths That Matter During Spikes
NVMe/TCP often runs on standard Ethernet, so network behavior can shape volume health in real time. Packet loss, jitter, and bad routing raise tail latency and trigger retries. Those retries can amplify the load, which can then raise the latency again.
CPU cost also matters. When the storage path burns too many cores per I/O, nodes lose headroom and pods compete harder for time slices. SPDK-style user-space I/O paths can reduce that overhead, which helps clusters keep latency steadier under load.
For executive reporting, translate this into simple risk: stable volume health needs stable network paths and an efficient data path, not just fast drives.
Measuring Kubernetes Volume Health Monitoring With Events, Metrics, and SLO Targets
Measure health with a small set of signals that map to action. Keep the list short so teams actually use it.
Latency percentiles show user impact first. Track p95 and p99 reads and writes. Error rate shows risk next, including timeouts and I/O failures. Mount success rate shows platform friction, especially during rollouts and drains. Queue depth and saturation show hidden backlog, which predicts tail latency spikes. Capacity headroom shows future failure risk because full pools trigger churn and slow rebuilds.
Tie these signals to SLO targets that match each workload tier. Do not set one global target for all apps. Instead, define tiers in your Software-defined Block Storage platform, then map apps to those tiers through StorageClass policy.
Fixes That Raise Volume Health Before Incidents Start
Use one standard playbook and keep it simple. The goal is fewer surprises during peak load and cluster churn.
- Set tier-based SLOs, and alert on p99 latency and error rate, not just averages
- Correlate CSI events with node CPU and network metrics to separate the root cause fast
- Enforce guardrails in StorageClass parameters so teams reuse safe defaults
- Cap noisy neighbors with QoS so one tenant cannot starve shared pools
- Test health during drains and rollouts, because churn often triggers the first warning signs
Health Monitoring Approaches Compared for Real Kubernetes Operations
Teams often mix tools and still miss the key signal. The table below shows what each approach does well and what it misses.
| Approach | What it catches fast | What it often misses | Best fit |
|---|---|---|---|
| Kubernetes events and CSI logs | Mount failures, attach delays, retry storms | Deep backend pool issues | Triage and incident timelines |
| Node metrics | CPU pressure, network drops, local stalls | Per-volume limits and pool health | Noisy neighbor detection |
| Backend volume and pool telemetry | Pool pressure, device risk, QoS hits | Pod context and scheduling churn | Capacity and long-term risk |
| SLO dashboards across tiers | User impact and trend drift | Exact error source without correlation | Exec reporting and guardrails |
Kubernetes Volume Health Monitoring With Simplyblock™ for Predictable Outcomes
Simplyblock™ supports Kubernetes Storage with Software-defined Block Storage and NVMe/TCP, so teams can monitor health at the volume and pool layers while keeping day-2 ops consistent across clusters. Simplyblock also supports multi-tenancy and QoS, which helps teams prevent one workload from turning shared storage into a bottleneck.
For operations, this means fewer unknowns. You can set clear tier rules, watch p99 latency and errors by tenant, and react with the same runbooks across environments. For leadership, it means more stable SLOs, fewer emergency node adds, and better cost control under growth.
Where Volume Health Monitoring Is Heading Next
Teams want fewer gaps between “warning” and “action.” Expect tighter links between health signals and policy, such as automated throttles, safer placement, and faster detection of bad paths during reschedules.
Observability stacks will also get more specific. More teams will track per-volume tail latency and mount success as first-class metrics. Platforms that already expose strong volume and pool signals will fit these workflows without heavy custom glue.
Related Terms
Teams often review these glossary pages alongside Kubernetes Volume Health Monitoring when they standardize Kubernetes Storage, NVMe/TCP, and Software-defined Block Storage.
CSIDriver Object
CSI Driver vs Sidecar
QoS Policy in CSI
Kubernetes StorageClass Parameters
Questions and Answers
Kubernetes Volume Health Monitoring tracks the status and accessibility of persistent volumes. It detects issues like mount failures, disk errors, or CSI driver faults early. This is especially critical for Kubernetes Stateful workloads where storage reliability directly affects uptime.
CSI drivers emit volume health status through metrics and events, which the Kubernetes control plane and monitoring tools can consume. Simplyblock’s Kubernetes CSI implementation supports this, ensuring early detection and observability of volume-related issues.
Prometheus, Grafana, and external health monitoring sidecars can be used to collect and visualize volume status. On platforms like Simplyblock, metrics can be tied into block storage replacement architectures to alert teams about storage degradation.
Yes. Any latency, I/O errors, or mount issues can severely impact database performance. Solutions like PostgreSQL on Simplyblock benefit from volume health monitoring to maintain performance SLAs and enable fast remediation.
By tracking underutilized or failing volumes, teams can decommission unused storage or reallocate resources. This supports strategies for optimizing Amazon EBS volumes cost and improving overall storage efficiency in cloud-native environments.